Midterm forecast:
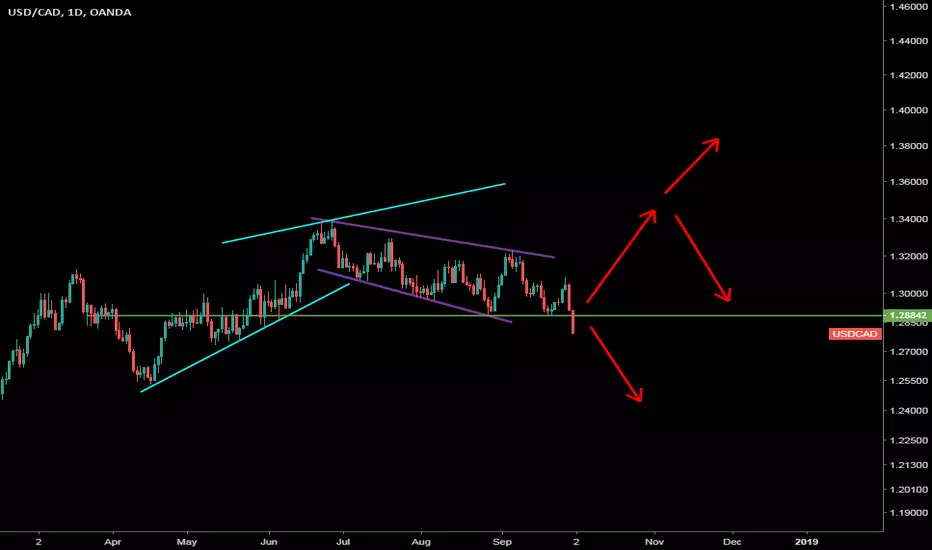
There is no trend in the market and the price is in a range bound, but we forecast an uptrend wave above 1.2885 would begin in Midterm.
Technical analysis:
While the RSI uptrend #1 is not broken, bullish wave in price would continue.
A peak is formed in daily chart at 1.3080 on 09/27/2018, so more losses minimum to Major Support (1.2885) is expected.
Price is below WEMA21, if price rises more, this line can act as dynamic resistance against more gains.
Relative strength index (RSI) is 41.
algorithmic trader - I have quantified sentiment necessary for trading elliott waves
免责声明
这些信息和出版物并非旨在提供,也不构成TradingView提供或认可的任何形式的财务、投资、交易或其他类型的建议或推荐。请阅读使用条款了解更多信息。
algorithmic trader - I have quantified sentiment necessary for trading elliott waves
免责声明
这些信息和出版物并非旨在提供,也不构成TradingView提供或认可的任何形式的财务、投资、交易或其他类型的建议或推荐。请阅读使用条款了解更多信息。