Hey guys,
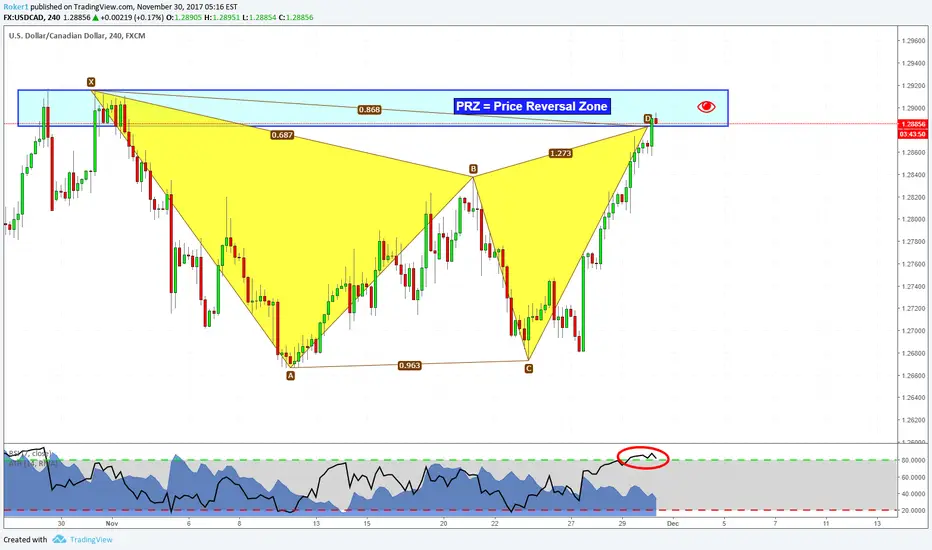
here on USDCAD we've just completed a Gartley formation on the 4hr timeframe. Obviously this D point lies right at the daily structure zone that you can see looking left. Now, given the circumstances i didn't take this trade yet but i'm waiting some kind of confirmations on the lower timeframe (hourly) or in this timeframe in form of a candlestick or something like that. RSI is already in overbought condition so i think the clues are all there. We just miss the entry trigger. Let's see, keep you updated!
If you have questions/ideas, feel free to share.
Otherwise, see you in the next chart!
注释
Let's see how price will react at the retest of the hourly highs, if it holds, it could be a 'sell':免责声明
这些信息和出版物并非旨在提供,也不构成TradingView提供或认可的任何形式的财务、投资、交易或其他类型的建议或推荐。请阅读使用条款了解更多信息。