We have an head and shoulder pattern on a 5M chart (not 15M as this one) 
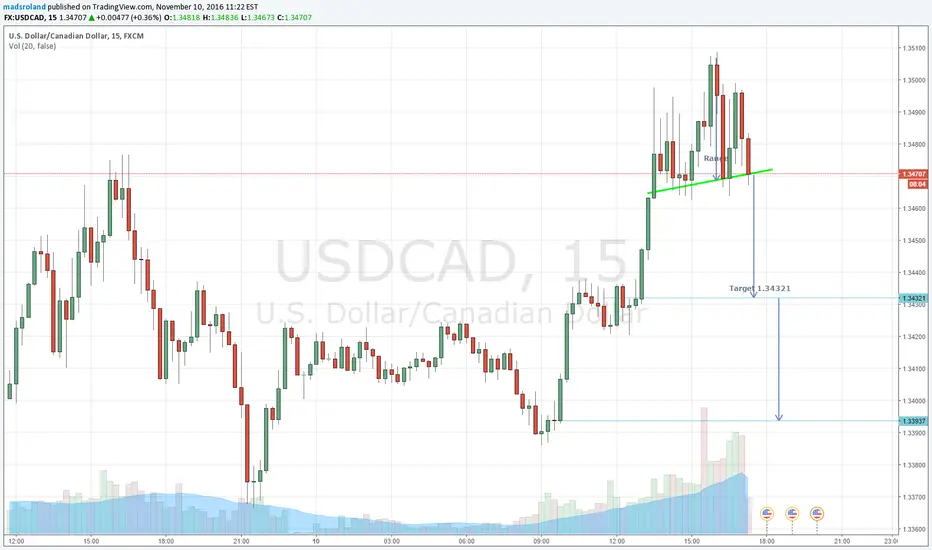
 USDCAD. It could be that it makes a small reversal after crossing the neckline to test it. Thereafter we could see a drop to 1.34421. Since it had such a strong up trend the last two days it could go event further down to 1.33940.
免责声明
这些信息和出版物并不意味着也不构成TradingView提供或认可的金融、投资、交易或其它类型的建议或背书。请在使用条款阅读更多信息。
免责声明
这些信息和出版物并不意味着也不构成TradingView提供或认可的金融、投资、交易或其它类型的建议或背书。请在使用条款阅读更多信息。