Hi guys,
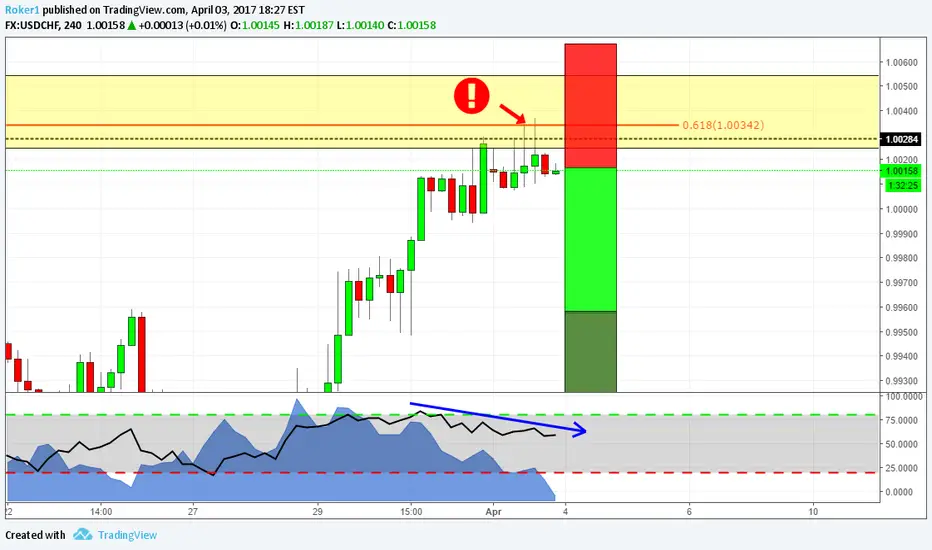
i'll briefly explain why i'm shorting this pair. The black line that you see represents a 4hr structure level; the yellow box represents the reversal zone based off of the daily chart. As the price reached this two level it started to slowing down. In addition, it gave us some signals that maybe wants to go lower: the first indecision sign is provided by the pinbar that you see highlighted with the red arrow, and it's also been followed by a red candle that closed below the previous opening. Also, the level lines up pretty well with the 618 retracement of the impulsive move down.
Rsi divergence tells us that the upward momentum is running out of fuel.
Stops above the highs, target1 at the 382 retracement of the previous move, target2 at the 618.
If you want to share your idea about this or simply ask questions, feel free to comment below.
Otherwise, see you in the next chart!
注释
Pay attention this is a counter trend trade, if you want to be more conservative, you could wait for the break of this ascending channel on the hourly chart:注释
Price broke the trendline, so you could wait and see how price reacts now, if it holds the next candle, you can short:注释
Nice rejection two times:注释
Beware of the Draghi's speech coming in 30 minutes, i'm going to watch closely to price action during that conference.注释
Draghi's conference will be at 16:30, sorry for the mistake.交易结束:到达止损
免责声明
这些信息和出版物并不意味着也不构成TradingView提供或认可的金融、投资、交易或其它类型的建议或背书。请在使用条款阅读更多信息。