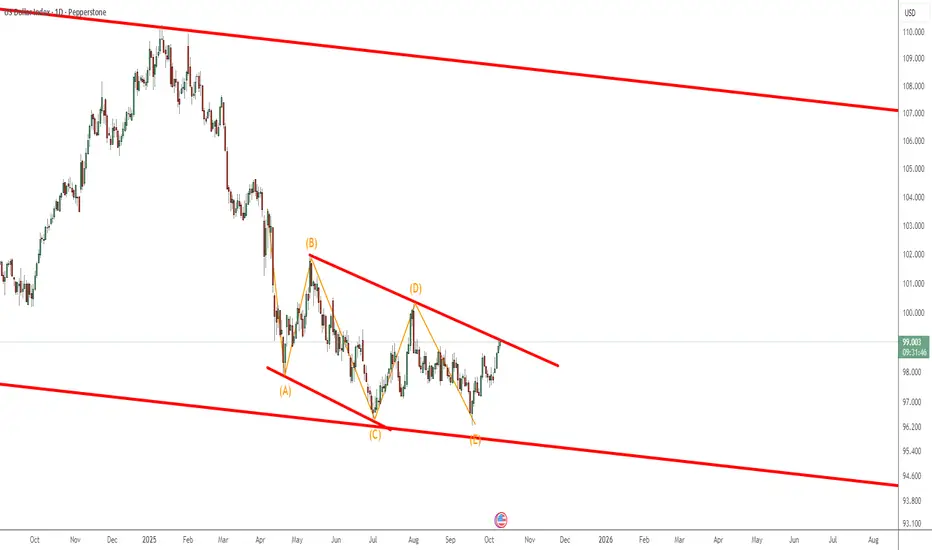
The DXY is currently testing the upper boundary of a well-defined ending diagonal pattern on the daily timeframe — a structure that often appears at the end of a corrective phase, signaling the beginning of a new impulsive move.
After months of consolidation inside the narrowing wedge, momentum is now turning upward, suggesting a potential bullish breakout is underway. This diagonal likely marks the final wave of a corrective decline (Wave 5 of C) — meaning a larger bullish cycle could be ready to unfold.
Key Technical Notes:
🔹 Price is challenging the upper diagonal resistance near 99.00–99.40.
🔹 A confirmed daily close above this zone would invalidate the bearish wedge and trigger a trend reversal signal.
🔹 Next upside targets: 101.00, 103.50, and potentially 107.00 in extension.
🔹 Pullbacks toward 97.50–98.00 may offer buy-the-dip opportunities within the breakout structure.
Wave Context:
This move could represent the early stages of a new impulse (Wave 1 or Wave A) following the completion of an ending diagonal — a classic reversal signal in Elliott Wave theory.
Momentum Outlook:
Bullish divergence and a tightening structure suggest sellers are exhausted. A confirmed breakout would likely ignite short covering and renewed USD strength across the board.
Bias: ✅ Bullish / Long-biased — watching for breakout confirmation above 99.40.
免责声明
这些信息和出版物并不意味着也不构成TradingView提供或认可的金融、投资、交易或其它类型的建议或背书。请在使用条款阅读更多信息。
免责声明
这些信息和出版物并不意味着也不构成TradingView提供或认可的金融、投资、交易或其它类型的建议或背书。请在使用条款阅读更多信息。