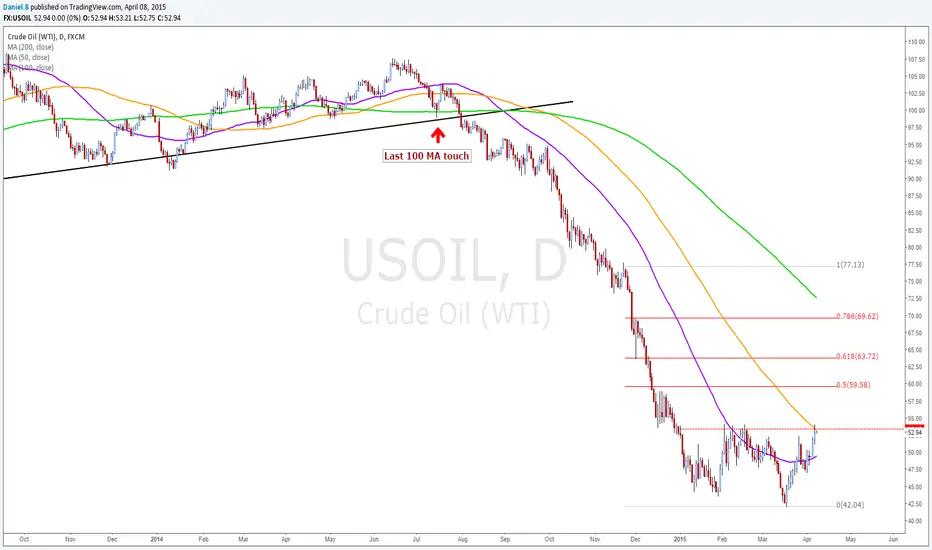
Well, as we all may of noticed by now, WTI crude is now testing this years highs, and a break above would mean that I look for more convenient buying opportunities. But the main point of this chart is to point out the numerous breakouts above the 50MA and more importantly the testing of the Daily 100MA resistance. Which is something we haven't seen since July of last year. There are many fundamental factors at play here, but I find it to time consuming to put a full on research report on T.V. lol. Anyhow, also marked on the chart are some resistance levels to keep in mind in the case of a break above.
免责声明
这些信息和出版物并不意味着也不构成TradingView提供或认可的金融、投资、交易或其它类型的建议或背书。请在使用条款阅读更多信息。