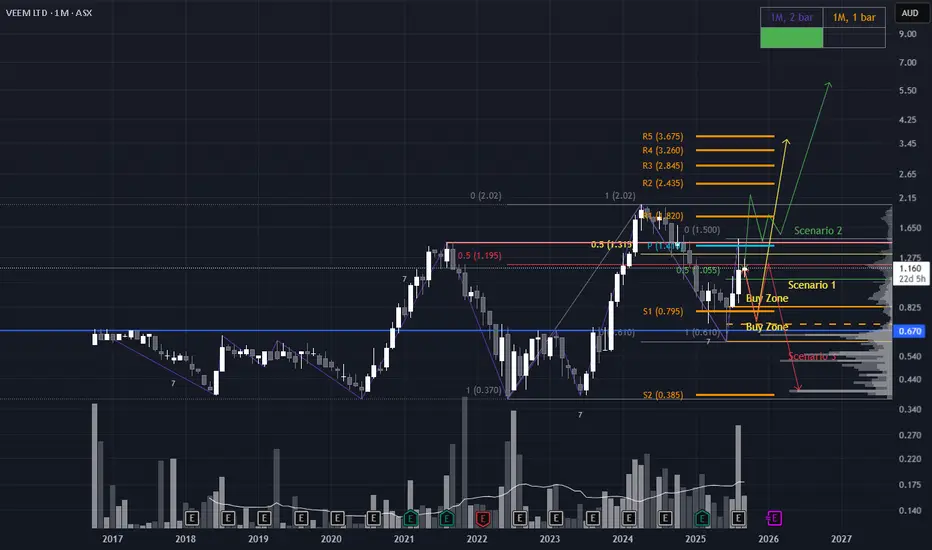
Scenario 1 (yellow line): Strategic Pullback to Value Zone
Price retraces to the ~$0.67 region, aligning with a Low Volume Node (LVN) and the Fair Value Gap from the June candle. A bullish reversal candle in this zone would signal a high-probability long setup, suggesting accumulation at a key structural level.
Scenario 2 (green line): Breakout & Reaccumulation Above Resistance
The most bullish scenario unfolds if price decisively breaks and closes above the major resistance at $1.50. A successful reaccumulation above this level would confirm strength, offering a textbook pullback entry for continuation higher.
Scenario 3: (red line) Rejection & Macro Lower High
Price pulls back but fails to hold above the ~$1.16 zone, facing rejection. A subsequent break of the recent lows would confirm a macro lower high (LH), shifting the bias toward bearish continuation and invalidating bullish setups.
免责声明
这些信息和出版物并非旨在提供,也不构成TradingView提供或认可的任何形式的财务、投资、交易或其他类型的建议或推荐。请阅读使用条款了解更多信息。
免责声明
这些信息和出版物并非旨在提供,也不构成TradingView提供或认可的任何形式的财务、投资、交易或其他类型的建议或推荐。请阅读使用条款了解更多信息。