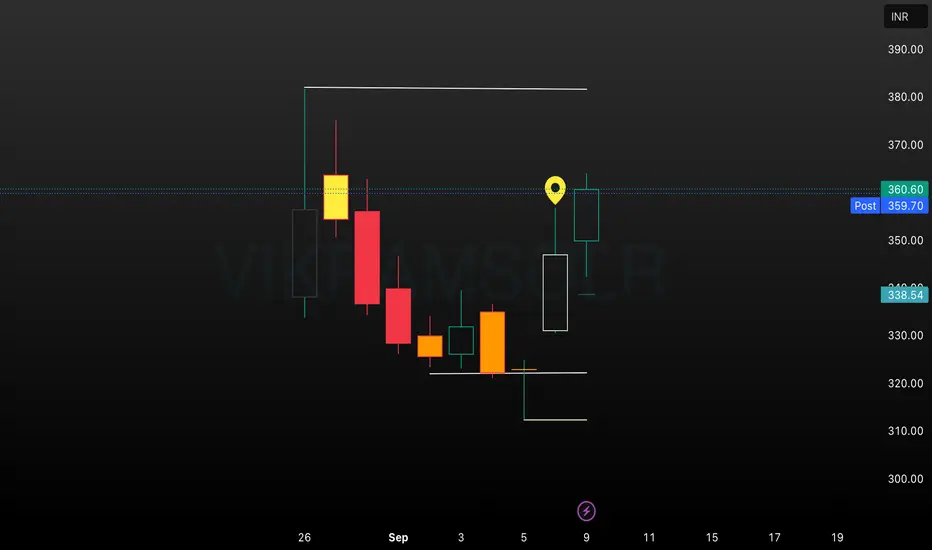
The VIKRAMSOLR daily chart illustrates a sustained recovery and momentum build-up after a series of bearish sessions. Price action rebounded from the recent low near ₹310–₹320, breaking past intermediate resistances with expanding volume and energized candlestick formation. The highlighted region signals renewed bullish participation and possible extension towards the next resistance
免责声明
这些信息和出版物并非旨在提供,也不构成TradingView提供或认可的任何形式的财务、投资、交易或其他类型的建议或推荐。请阅读使用条款了解更多信息。
免责声明
这些信息和出版物并非旨在提供,也不构成TradingView提供或认可的任何形式的财务、投资、交易或其他类型的建议或推荐。请阅读使用条款了解更多信息。