做多
WAVES: 4 Hour Chart. Breakout soon?
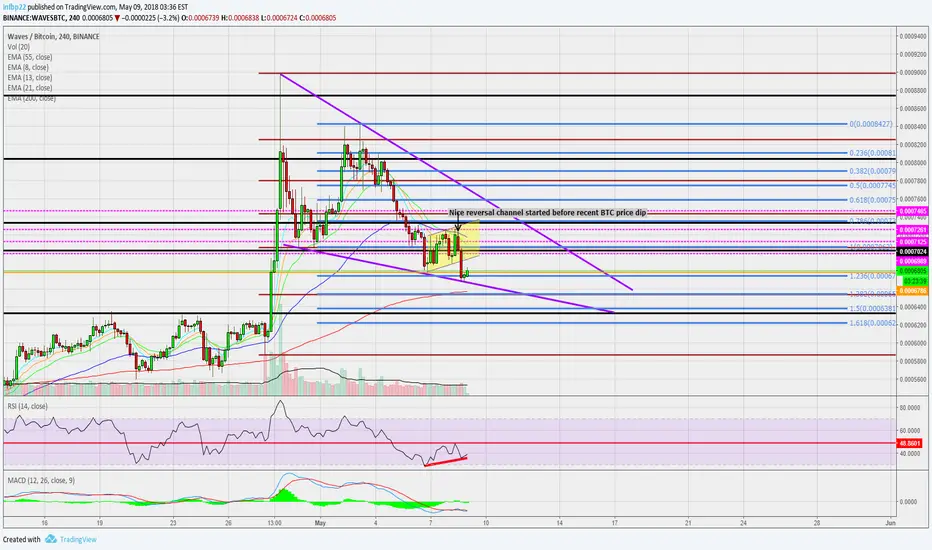
Waves took a nice little dip on this recent drop, which I bought. See the chart, I think it's going to go back onto its path and continue up to break out of the potential descending wedge. RSI it 17 on the 15min chart on the drop, and it looks like we may have some bullish divergence on the 4 hour chart now. I'm already in this trade at the orange line.
免责声明
这些信息和出版物并不意味着也不构成TradingView提供或认可的金融、投资、交易或其它类型的建议或背书。请在使用条款阅读更多信息。