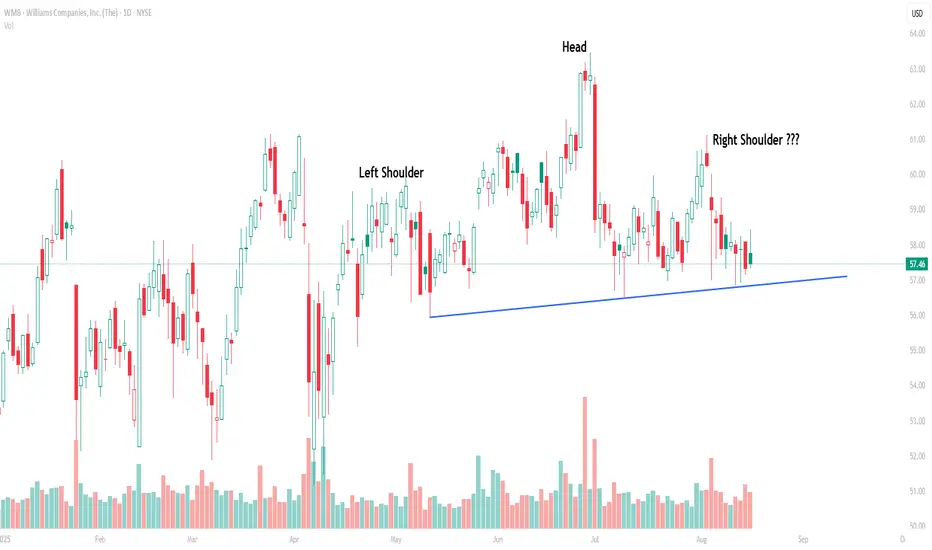
Key Note: Let’s keep it straight — until the neckline breaks, this remains a potential Head
& Shoulders (H&S), not a confirmed one. A close below $56.5 on strong volume would
be the real confirmation trigger.
Currently, WMB is sketching what looks like a bearish Head & Shoulders pattern. The
left shoulder was formed in April near $60, the head at the June peak around $63 and the
right shoulder is emerging with the recent rally stalling back at $60. The neckline aligns
with the rising trendline support around $57, which has been repeatedly tested.
If the neckline gives way, the breakdown completes the bearish setup, with a measured
downside projection of roughly $50, based on the head-to-neckline height. Until then,
this remains just a developing structure rather than a done deal.
Sharing indicator studies & global setups | twitter.com/gautam_icma
免责声明
这些信息和出版物并不意味着也不构成TradingView提供或认可的金融、投资、交易或其它类型的建议或背书。请在使用条款阅读更多信息。
Sharing indicator studies & global setups | twitter.com/gautam_icma
免责声明
这些信息和出版物并不意味着也不构成TradingView提供或认可的金融、投资、交易或其它类型的建议或背书。请在使用条款阅读更多信息。