While BTC slid, TeraWulf has climbed 43% over two weeks, showcasing exceptional relative strength.
This resilience signals robust underlying demand across the broader crypto-mining space and reinforces the upside momentum reflected in the Q-models.
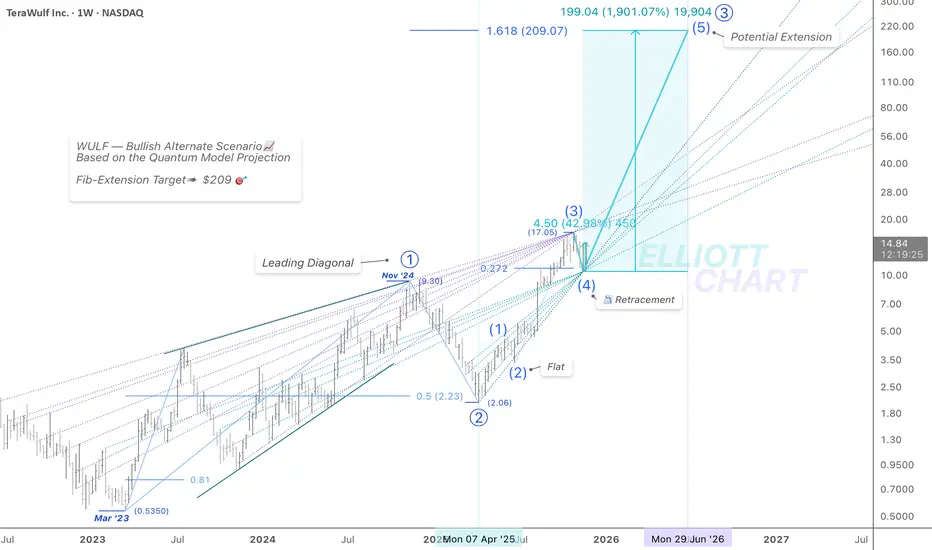
Wave | Trend Analysis
The correction in Intermediate Wave (4) reached the 0.272 Fibonacci retracement last week, culminating in a sharp pullback that paused precisely at the apex of the convergent support-equivalence lines.
As illustrated on the chart, the confluence areas where the extended equivalence lines converge may now serve as a high-probability support zone.
From this level, the model favours an extension into Intermediate Wave (5) within Primary Wave ⓷, projecting an impulsive advance toward ➤ $209 🎯 — a target that aligns with the 1.618 Fibonacci extension of the Leading Diagonal established in Primary Wave ⓵.
As noted earlier, the Leading Diagonal in Primary Wave ⓵ — originating in March 2023 — represents a potentially bullish structure, indicating an early-stage transition into a bullish accumulation phase. According to my framework, such motive patterns often precede strong impulsive advances, reinforcing the broader bullish narrative as the Cycle-degree Uptrend continues to unfold.
🔖 In my Quantum Models methodology, the equivalence lines function as structural elements, anchoring the model’s internal geometry and framing the progression of alternate paths.
#QuantumModels #EquivalenceLines #Targeting #MarketAnalysis #TechnicalAnalysis #ElliottWave #WaveAnalysis #TrendAnalysis #StocksToWatch #FibLevels #FinTwit #Investing #MiningStocks #CleanEnergy #SustainableMining #EnergyTech #TechStocks #Equities #DataCenters #BitcoinMining #CryptoMining #AIStocks #HPC #AI #BTC #Bitcoin #BTCUSD
免责声明
这些信息和出版物并非旨在提供,也不构成TradingView提供或认可的任何形式的财务、投资、交易或其他类型的建议或推荐。请阅读使用条款了解更多信息。
免责声明
这些信息和出版物并非旨在提供,也不构成TradingView提供或认可的任何形式的财务、投资、交易或其他类型的建议或推荐。请阅读使用条款了解更多信息。