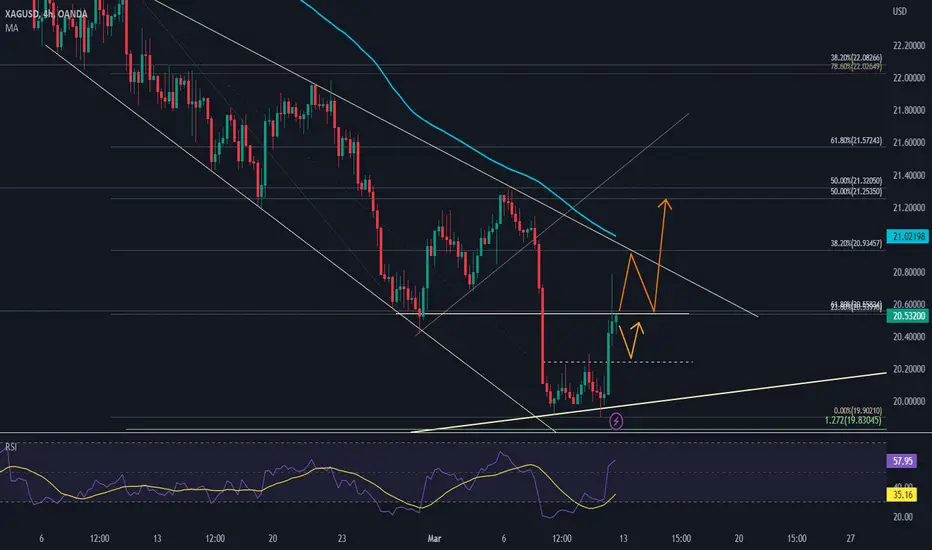
The daily silver chart has shown a strong engulfing candle that has absorbed two days of trading, along with a divergence on momentum indicators between the recent lows and touching the last low of an ascending yearly trendline. These are all indications of a potential change in price direction from bearish to bullish. Looking at the 4-hour timeframe to try and determine the next price movement based on the overall trend, we can see that the price settled last week at a resistance level of 20.55, which is also the 61.8 Fibonacci level. My expectations for the price are either a slight downward correction to retest the neckline of the recent lows at the 20.25 level before continuing upward to 20.93, or a direct move upward to the 20.93 level, which is where a descending trendline intersects with the 100-period moving average on the 4-hour timeframe and the 38.20 Fibonacci level.
-------------------------------------------------------------------------
Let me know your thoughts in the comments, and show your support by liking the idea.
Please follow if you're interested in more ideas like this.
Your support is greatly appreciated!
-------------------------------------------------------------------------
Let me know your thoughts in the comments, and show your support by liking the idea.
Please follow if you're interested in more ideas like this.
Your support is greatly appreciated!
免责声明
这些信息和出版物并不意味着也不构成TradingView提供或认可的金融、投资、交易或其它类型的建议或背书。请在使用条款阅读更多信息。
免责声明
这些信息和出版物并不意味着也不构成TradingView提供或认可的金融、投资、交易或其它类型的建议或背书。请在使用条款阅读更多信息。