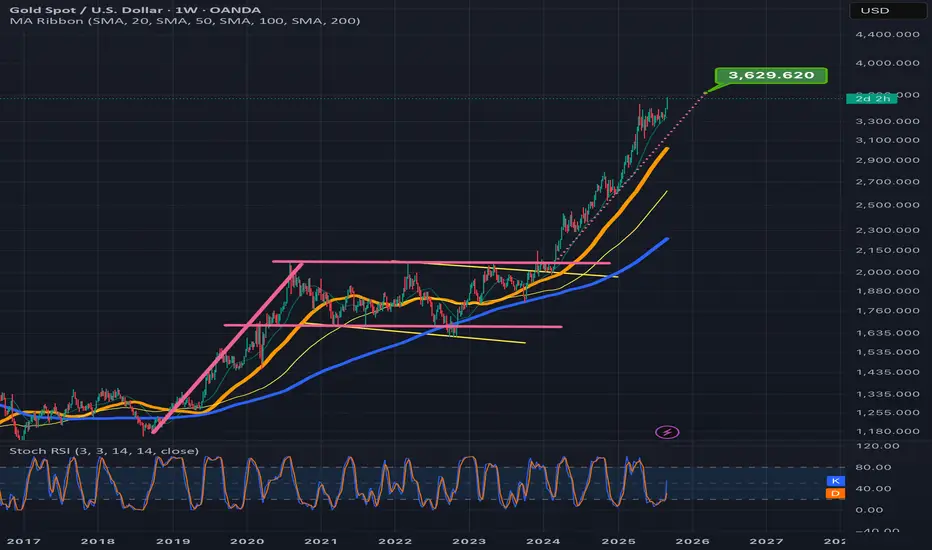
TA doesn’t get much more exact than this. Gold beautifully displayed why TA is such a powerful manifestation device. Look how perfectly Gold broke up and then used the dotted measured move line as a staircase to climb its way to the full breakout target. Perfection. Those who’s off at TA as just imaginary or arbitrary lines, have not seen this kind of accuracy play outthe and time again as I have during my time as a technical analyst. Posting this as a prime example for posterity. *not financial advice*
注释
Within $5 of the target注释
Target hit!免责声明
这些信息和出版物并不意味着也不构成TradingView提供或认可的金融、投资、交易或其它类型的建议或背书。请在使用条款阅读更多信息。
免责声明
这些信息和出版物并不意味着也不构成TradingView提供或认可的金融、投资、交易或其它类型的建议或背书。请在使用条款阅读更多信息。