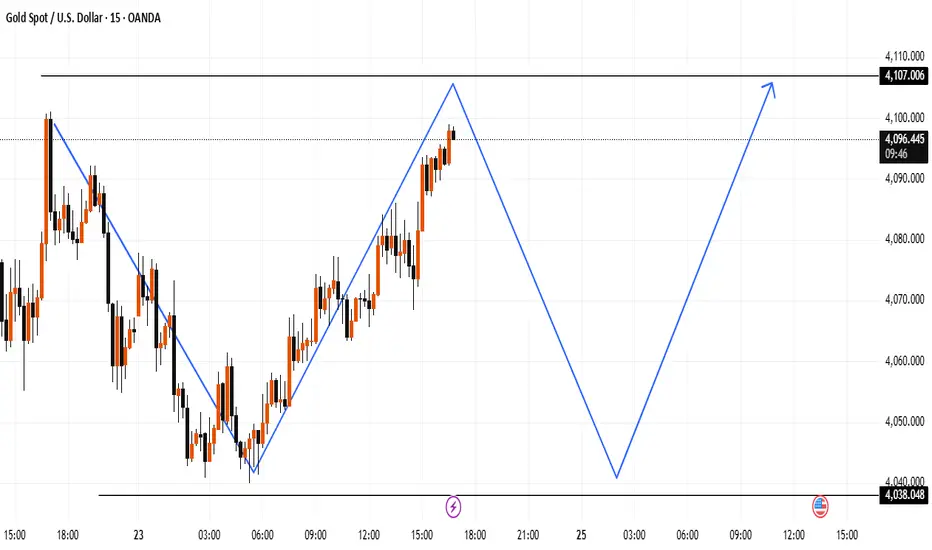
This chart highlights a possible short-term completion of the current upward leg, followed by a deeper corrective move toward the lower support zone near 4038, before a potential bullish continuation toward the 4107 area.
The projection is based on simple market structure:
Price has reached a previous reaction zone.
A corrective wave may form if rejection appears.
A new impulse could develop from the lower support level.
The projection is based on simple market structure:
Price has reached a previous reaction zone.
A corrective wave may form if rejection appears.
A new impulse could develop from the lower support level.
交易开始
its time to trade active免责声明
这些信息和出版物并非旨在提供,也不构成TradingView提供或认可的任何形式的财务、投资、交易或其他类型的建议或推荐。请阅读使用条款了解更多信息。
免责声明
这些信息和出版物并非旨在提供,也不构成TradingView提供或认可的任何形式的财务、投资、交易或其他类型的建议或推荐。请阅读使用条款了解更多信息。