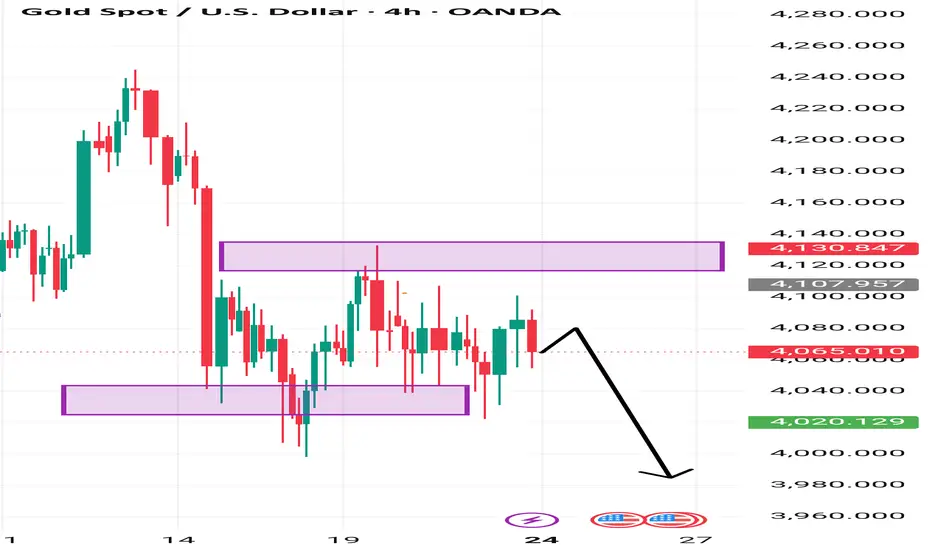
Why a Drop Makes Sense (Bearish Bias)
✔ Repeated rejections from the upper supply zone
The large purple zone around 4120–4130 has already rejected price multiple times
→ showing strong sellers there.
✔ Lower highs forming
The candles show a series of lower highs, meaning bulls are failing to push up.
✔ Price failing to break 4080–4090
This zone is acting as strong intraday resistance.
Your arrow shows price retesting it — that is a typical retracement before continuation down.
We share XAUUSD (Gold) signals based on market analysis.
Educational content to help traders make informed decisions.
Educational content to help traders make informed decisions.
免责声明
这些信息和出版物并非旨在提供,也不构成TradingView提供或认可的任何形式的财务、投资、交易或其他类型的建议或推荐。请阅读使用条款了解更多信息。
We share XAUUSD (Gold) signals based on market analysis.
Educational content to help traders make informed decisions.
Educational content to help traders make informed decisions.
免责声明
这些信息和出版物并非旨在提供,也不构成TradingView提供或认可的任何形式的财务、投资、交易或其他类型的建议或推荐。请阅读使用条款了解更多信息。