Hello everyone, I hope you're ready for an exciting trading day!
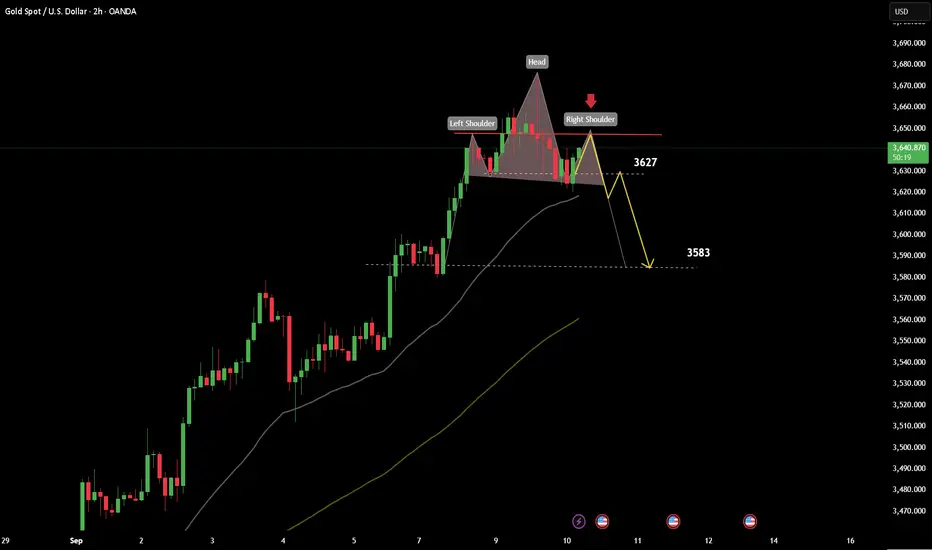
Looking at the gold chart, we’re seeing a powerful signal from the Head and Shoulders pattern, with resistance at 3,627 USD – a key level that can't be ignored. The accumulation of selling pressure is gradually pushing gold prices down, and if this pattern continues to develop, the possibility of gold dropping to the support level of 3,583 USD is very high.
This is the time when technical signals are clearer than ever, and if you're looking for a trading opportunity, this is the moment you can't miss. Always remember: risk management is the key to success.
Wishing you all profitable trades and don’t forget to follow my latest updates! See you in the next analysis!
交易开始
注释
It has broken through the nearest support level and is now getting closer to 3583.相关出版物
免责声明
这些信息和出版物并不意味着也不构成TradingView提供或认可的金融、投资、交易或其它类型的建议或背书。请在使用条款阅读更多信息。