✅ 4-Hour Chart Analysis:
Gold has entered a clear correction phase after a prolonged rally, with a recent high near 4379.52 followed by a sharp drop to around 4215.
Currently, the price is trading above the Bollinger middle band (around 4111), while MA5, MA10, and MA20 are all turning downward — indicating that short-term bullish momentum is weakening.
The Bollinger Bands are beginning to narrow, suggesting that volatility is calming. As long as the price holds above MA20 (around 4110), the medium-term bullish structure remains intact.
In the short term, gold may continue to consolidate between 4210–4280. If it breaks below 4200, a further correction toward 4150–4170 is possible.
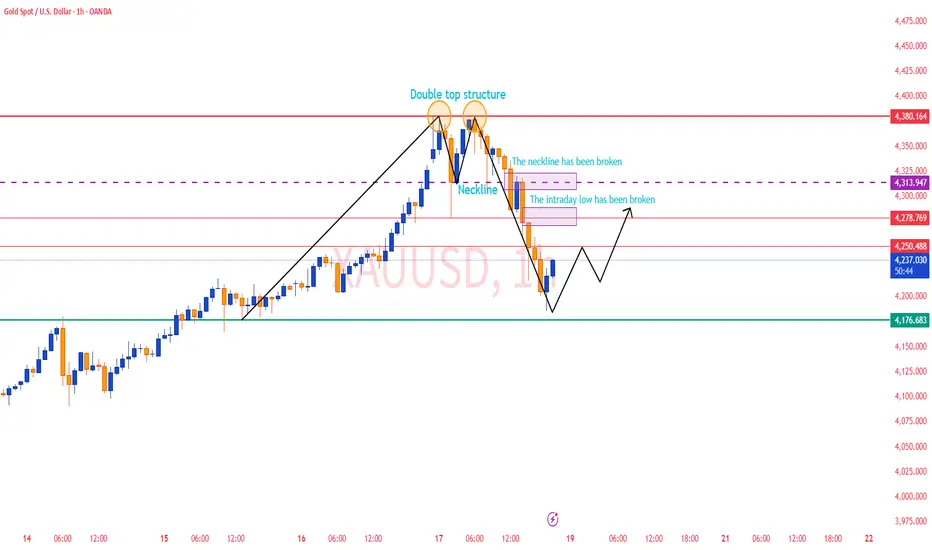
✅ 1-Hour Chart Analysis:
On the 1-hour timeframe, gold has shown a steady decline after peaking near 4379, confirming a short-term bearish shift.
MA5, MA10, and MA20 have formed a bearish crossover, and the Bollinger Bands are opening downward — indicating that bears currently dominate the market.
The price is hovering near the lower Bollinger Band (around 4210), suggesting a potential for a short-term rebound, but resistance lies at 4240–4250.
If the rebound fails to hold, gold is likely to remain in a weak consolidation range between 4200–4250.
🔴 Resistance Levels: 4240–4250 / 4280–4290 / 4320
🟢 Support Levels: 4200–4190 / 4170–4150
✅ Trading Strategy Reference:
🔰 If the price rebounds to 4240–4250 and faces resistance, consider light short positions.
🎯 Targets: 4210 / 4190
🔰 If gold retraces to the 4170–4190 zone and holds steady, consider entering long positions in batches.
🎯 Targets: 4230 / 4250
📊 Summary:
Gold has entered a high-level correction phase after an extended rally. The medium-term bullish trend is still valid, but momentum has slowed.
Traders are advised to control position size, stay flexible, and wait for clearer direction before making larger commitments.
Gold has entered a clear correction phase after a prolonged rally, with a recent high near 4379.52 followed by a sharp drop to around 4215.
Currently, the price is trading above the Bollinger middle band (around 4111), while MA5, MA10, and MA20 are all turning downward — indicating that short-term bullish momentum is weakening.
The Bollinger Bands are beginning to narrow, suggesting that volatility is calming. As long as the price holds above MA20 (around 4110), the medium-term bullish structure remains intact.
In the short term, gold may continue to consolidate between 4210–4280. If it breaks below 4200, a further correction toward 4150–4170 is possible.
✅ 1-Hour Chart Analysis:
On the 1-hour timeframe, gold has shown a steady decline after peaking near 4379, confirming a short-term bearish shift.
MA5, MA10, and MA20 have formed a bearish crossover, and the Bollinger Bands are opening downward — indicating that bears currently dominate the market.
The price is hovering near the lower Bollinger Band (around 4210), suggesting a potential for a short-term rebound, but resistance lies at 4240–4250.
If the rebound fails to hold, gold is likely to remain in a weak consolidation range between 4200–4250.
🔴 Resistance Levels: 4240–4250 / 4280–4290 / 4320
🟢 Support Levels: 4200–4190 / 4170–4150
✅ Trading Strategy Reference:
🔰 If the price rebounds to 4240–4250 and faces resistance, consider light short positions.
🎯 Targets: 4210 / 4190
🔰 If gold retraces to the 4170–4190 zone and holds steady, consider entering long positions in batches.
🎯 Targets: 4230 / 4250
📊 Summary:
Gold has entered a high-level correction phase after an extended rally. The medium-term bullish trend is still valid, but momentum has slowed.
Traders are advised to control position size, stay flexible, and wait for clearer direction before making larger commitments.
免责声明
这些信息和出版物并不意味着也不构成TradingView提供或认可的金融、投资、交易或其它类型的建议或背书。请在使用条款阅读更多信息。
免责声明
这些信息和出版物并不意味着也不构成TradingView提供或认可的金融、投资、交易或其它类型的建议或背书。请在使用条款阅读更多信息。