Hi ladies.
If you are using tons of tools to identify supply/support and demand/resistances zones. STOP.
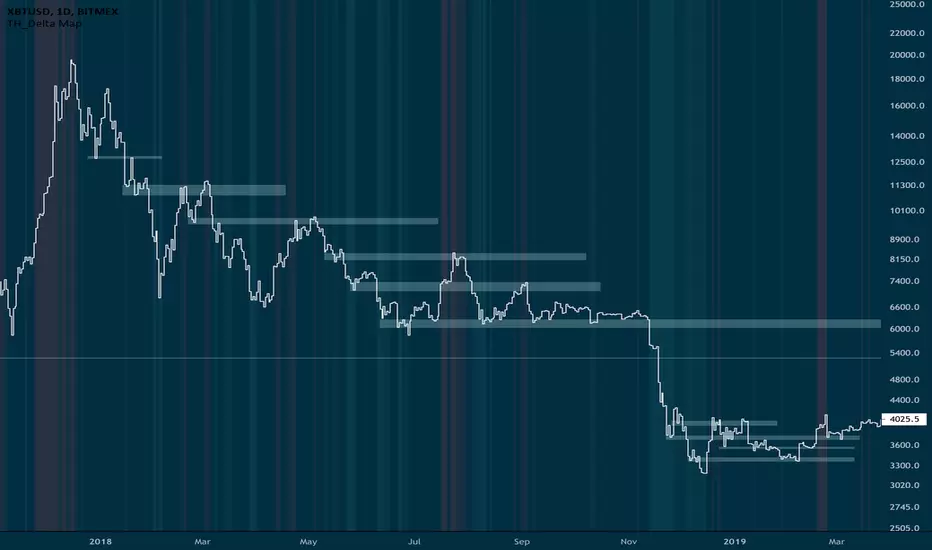
All you need is to apply this simple approach using past price action.
Switch to line chart on M, W and Daily timeframes and identify the Lower closes where price bounces. Map the zone to the left et voila.
All these zones are likely to represent important resistance zones in the future once price goes under them again. We can also look into zones with higher volume signatures which give higher significance to these resistances as well as consolidated sideway at those lows.
Best.
TH
If you are using tons of tools to identify supply/support and demand/resistances zones. STOP.
All you need is to apply this simple approach using past price action.
Switch to line chart on M, W and Daily timeframes and identify the Lower closes where price bounces. Map the zone to the left et voila.
All these zones are likely to represent important resistance zones in the future once price goes under them again. We can also look into zones with higher volume signatures which give higher significance to these resistances as well as consolidated sideway at those lows.
Best.
TH
D7R
免责声明
这些信息和出版物并非旨在提供,也不构成TradingView提供或认可的任何形式的财务、投资、交易或其他类型的建议或推荐。请阅读使用条款了解更多信息。