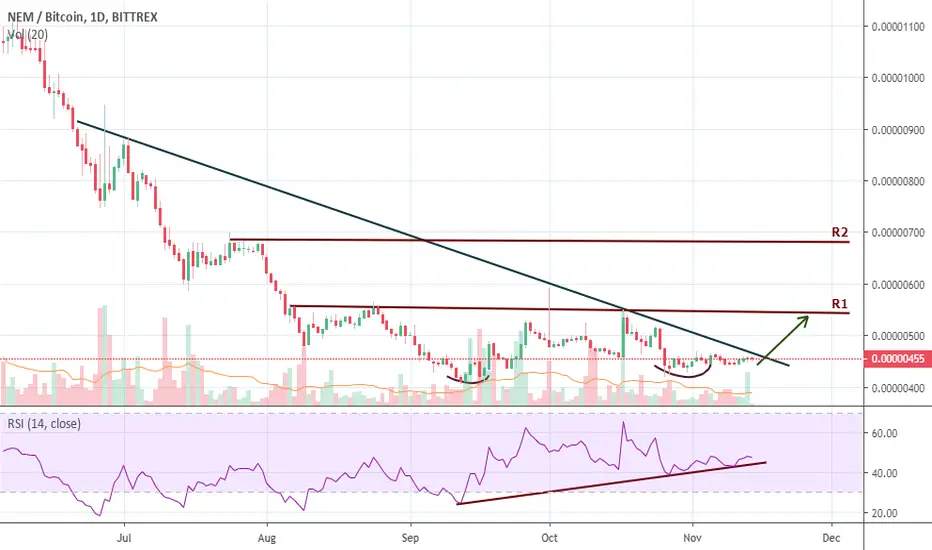
Based on the chart, NEM probably bottomed at 410-420 sats. It perfectly held the previous low when the price retest the support/previous low at 410-420 sats.
In addition, RSI shows a strong sign that it is now in an upward trend.
Now, if the price breaks the trendline it will test the 1st resistance line at 550 sats.
Just remember don't forget to set up a stop-loss because most of the ALTCOINS follow the BITCOIN movement.
Hit Like and Follow me for more updates!
Happy Trading!
Please do your charting and research.
免责声明
这些信息和出版物并不意味着也不构成TradingView提供或认可的金融、投资、交易或其它类型的建议或背书。请在使用条款阅读更多信息。
免责声明
这些信息和出版物并不意味着也不构成TradingView提供或认可的金融、投资、交易或其它类型的建议或背书。请在使用条款阅读更多信息。