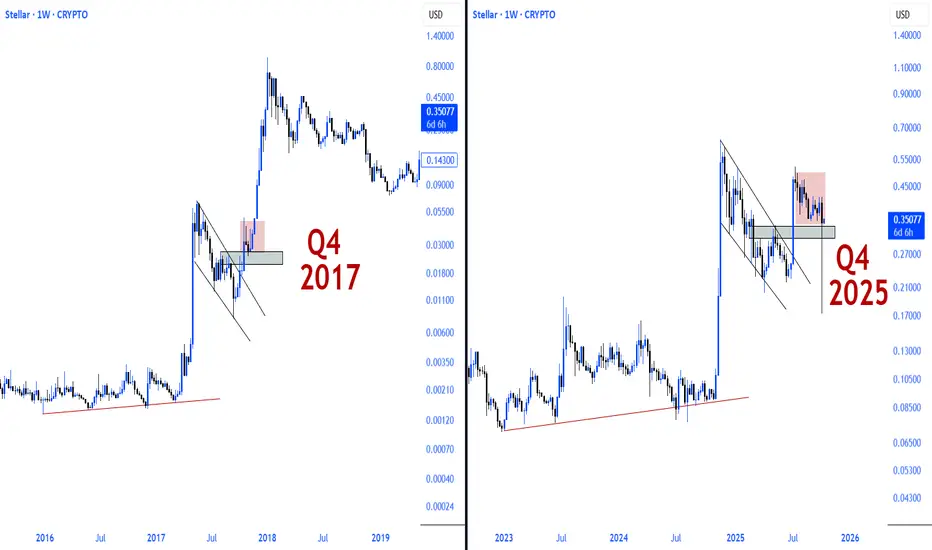
The 2017 and 2025  XLM structures are strikingly similar.
In 2017, a breakout occurred following a prolonged descending wedge formation, which then began a parabolic run after a brief accumulation phase above the demand zone.
The 2025 structure also forms a similar technical foundation.
Technical reflections of historical cycles.
Same structure, different cycle. However, market psychology and price behavior are shaped similarly.
While times may change, the recurrence of technical patterns is the clearest indicator of cyclical nature.
Dynamics that worked in the past are returning to the scene in the new cycle.
XLM is once again recapturing its historical rhythm.
XLM is the inseparable shadow of XRP.
If XRP runs, XLM will surely follow.
免责声明
这些信息和出版物并非旨在提供,也不构成TradingView提供或认可的任何形式的财务、投资、交易或其他类型的建议或推荐。请阅读使用条款了解更多信息。
免责声明
这些信息和出版物并非旨在提供,也不构成TradingView提供或认可的任何形式的财务、投资、交易或其他类型的建议或推荐。请阅读使用条款了解更多信息。