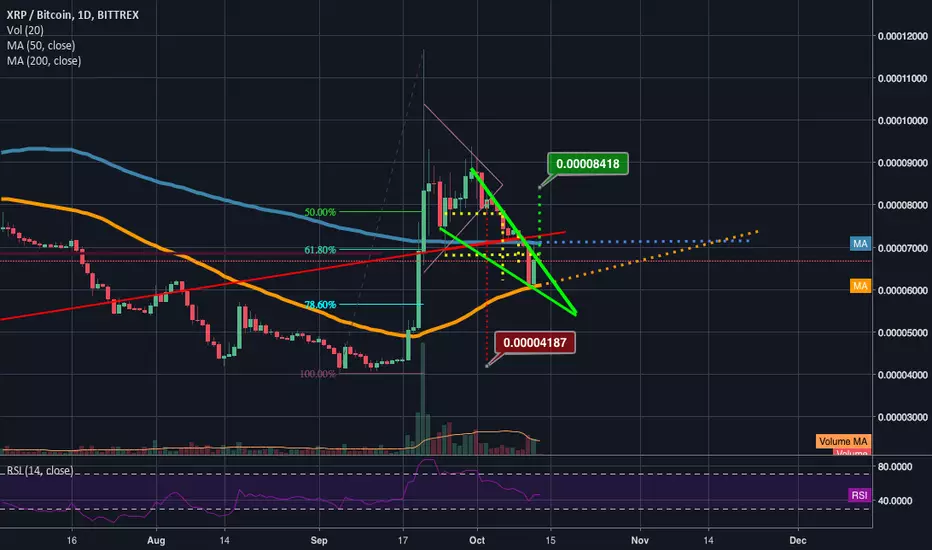
Though XRP has been consolidating well inside the falling wedge(which tend to break bullishly) we must still keep in mind that since we broke down from the 4hr symmetrical triangle pattern not too long ago, we may still have more room to dip seeing as how even though we reached our head and shoulder breakdown target, we didn't hit the drop target of the symmetrical triangle pattern just yet. That's not to say every pattern that breaks down reaches its exact price target, in fact, many fall short, many end up over too, but most are always pretty close to the exact target give or take a pip. To put it more simply. There is a good bull case here but also still a case for the bears. Being an optimist, I'm goin long and the longer we skirt along this current support line the greater the odds of it inverse barting upwards. Shown here on the chart are the bullish and bearish price target from each pattern. Also in blue and orange, the 1day chart 50(orange), and 200(blue simple moving averages and the current trajectory for their golden cross. Still a chance we could dip down to the next fib line under our current supprot before the ultimate bounce therefore finding away to still fulfill the bear target drop and trigger the bull falling wedge at the same time. All outcomes worth considering even though financial advice they are not. Thanks for reading!
免责声明
这些信息和出版物并不意味着也不构成TradingView提供或认可的金融、投资、交易或其它类型的建议或背书。请在使用条款阅读更多信息。
免责声明
这些信息和出版物并不意味着也不构成TradingView提供或认可的金融、投资、交易或其它类型的建议或背书。请在使用条款阅读更多信息。