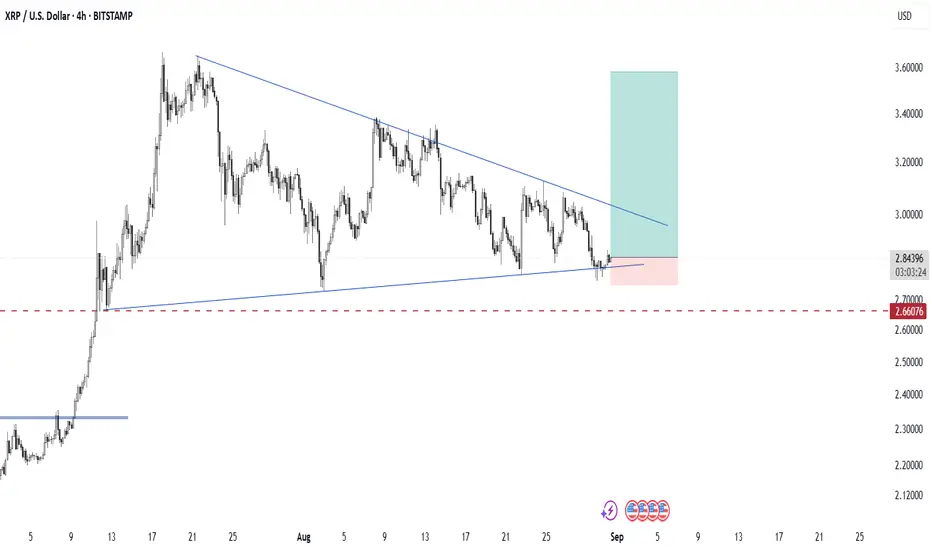
XRP is currently consolidating within a symmetrical triangle pattern, with price action forming lower highs and higher lows. This indicates a period of compression where volatility is decreasing, and a potential breakout could be approaching.
At the moment, the price is testing the lower boundary of the triangle, showing signs of support. As long as XRP holds above the $2.66 support level (highlighted by the dashed red line), the bullish scenario remains valid.
Pattern: Symmetrical Triangle (continuation/neutral pattern)
Entry Zone: Current support trendline near $2.18–$2.20
Stop Loss: Below $2.66 support zone
Target Zone: $3.40 – $3.60 (upper projection of the triangle)
📌 A confirmed breakout above the descending trendline could trigger strong bullish momentum, while a breakdown below $2.66 would invalidate this setup and open the door for deeper correction.
免责声明
这些信息和出版物并非旨在提供,也不构成TradingView提供或认可的任何形式的财务、投资、交易或其他类型的建议或推荐。请阅读使用条款了解更多信息。