I like to keep stats on my predictions, and so should you. How else can you tell if someone is worth following? So, here's a recap since my first Xrp post ever, made on July 23rd 2025.
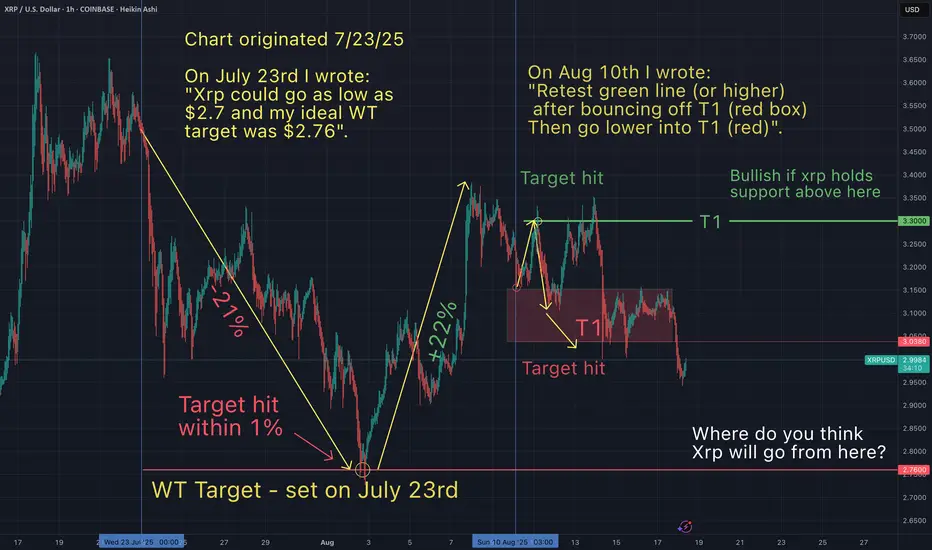
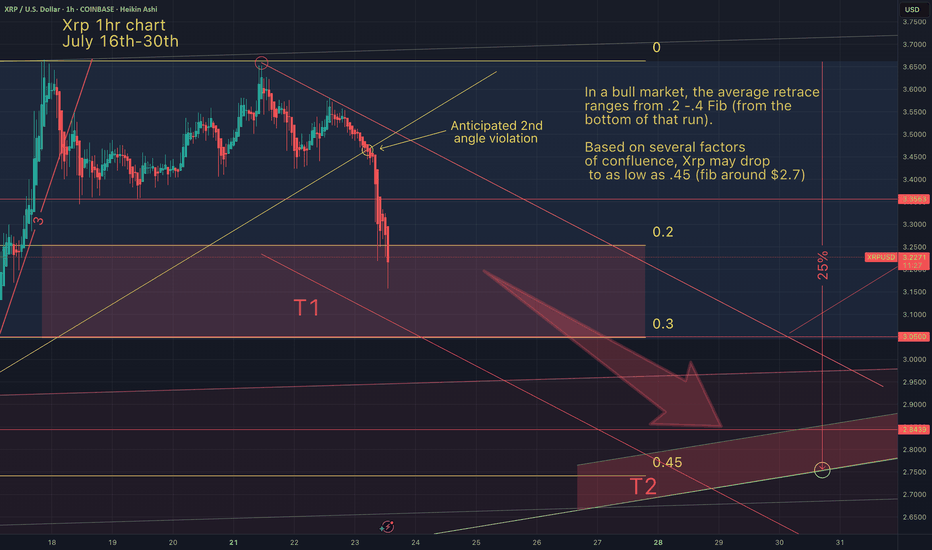
July 23rd- I suggested Xrp could go as low as $2.7 (a -25% dump from that day).
July 28th- As Xrp approached $2.7 I refined my predicition to a WT target of $2.76
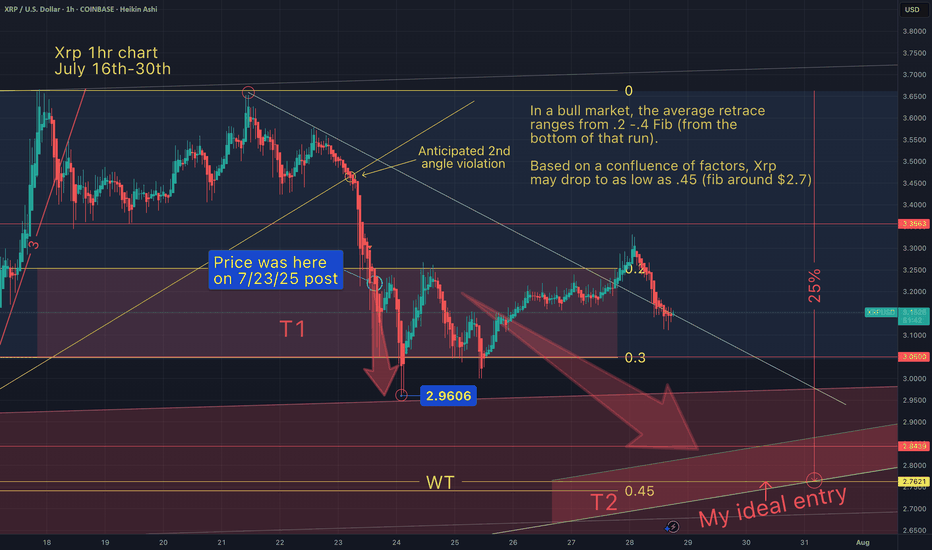
Aug 2nd- My $2.76 WT target was hit (within 1%). See below

Aug 7th- I expected a big bounce from my WT target (20+%) and I followed up with a post, as we started to get close to that next top.

Aug 10- I called "the top was in", and I suggested that Xrp would drop to my support range of $3.03-$3.15 within 1-3 days. That target was hit 1.5 days later. I also suggested Xrp would bounce from my red T1 box and retrace up to my T1 green line...and then go lower into my red box. My calls on direction and target for each of these 3 moves were confirmed. See below.

Aug 11th- Xrp went lower into my red box as anticipated.

Notice in all of my charts, I do not simply offer support and resistance zones (as some influencers do). I anticipate the direction the asset will take as it travels through these zones. Simply identifying support and resistance is not enough to execute profitable trades. I hope that my accuracy in determining directionality and precise targets has been of benefit to you. I would like to see us all succeed.
Please note, I'm not sure how much longer I will continue to chart at this pace, being that it takes a lot of time & effort to bring you these free gold nuggets. Let me know if you want me to show you how I draw these maps to the gold mine.
July 23rd- I suggested Xrp could go as low as $2.7 (a -25% dump from that day).
July 28th- As Xrp approached $2.7 I refined my predicition to a WT target of $2.76
Aug 2nd- My $2.76 WT target was hit (within 1%). See below
Aug 7th- I expected a big bounce from my WT target (20+%) and I followed up with a post, as we started to get close to that next top.
Aug 10- I called "the top was in", and I suggested that Xrp would drop to my support range of $3.03-$3.15 within 1-3 days. That target was hit 1.5 days later. I also suggested Xrp would bounce from my red T1 box and retrace up to my T1 green line...and then go lower into my red box. My calls on direction and target for each of these 3 moves were confirmed. See below.
Aug 11th- Xrp went lower into my red box as anticipated.
Notice in all of my charts, I do not simply offer support and resistance zones (as some influencers do). I anticipate the direction the asset will take as it travels through these zones. Simply identifying support and resistance is not enough to execute profitable trades. I hope that my accuracy in determining directionality and precise targets has been of benefit to you. I would like to see us all succeed.
Please note, I'm not sure how much longer I will continue to chart at this pace, being that it takes a lot of time & effort to bring you these free gold nuggets. Let me know if you want me to show you how I draw these maps to the gold mine.
May the trends be with you.
免责声明
这些信息和出版物并非旨在提供,也不构成TradingView提供或认可的任何形式的财务、投资、交易或其他类型的建议或推荐。请阅读使用条款了解更多信息。
May the trends be with you.
免责声明
这些信息和出版物并非旨在提供,也不构成TradingView提供或认可的任何形式的财务、投资、交易或其他类型的建议或推荐。请阅读使用条款了解更多信息。