XRP/USDT charts highlight a tightening price structure that hints at a possible breakout. With regulatory clarity emerging and XRP adoption increasing, traders are watching closely. This analysis explores the technical outlook for XRP, including trendlines, support-resistance zones, RSI signals, and volume metrics that may signal XRP’s next major move.
Current Market Structure (as of July 2025)
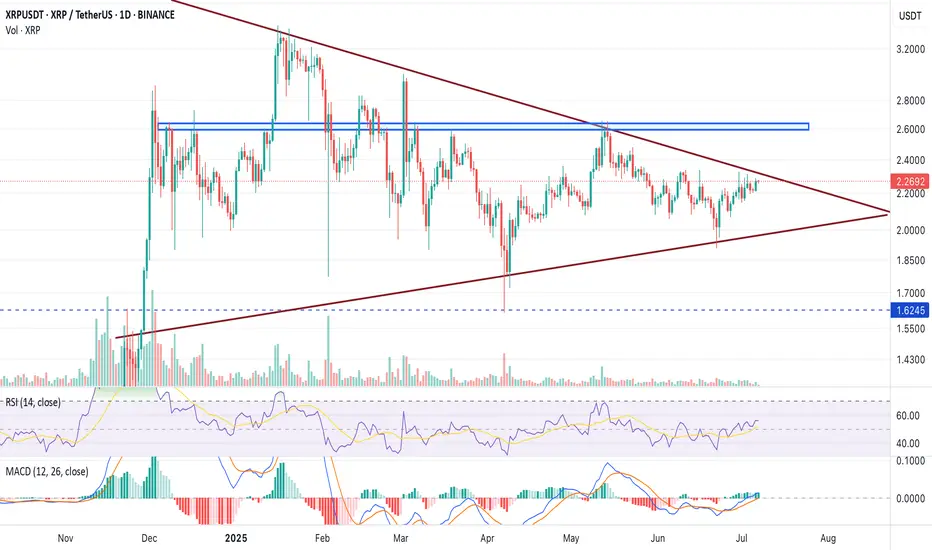
On the daily chart, XRP is forming a symmetrical triangle pattern, a classic consolidation setup that often leads to a breakout when accompanied by rising volume. The lower highs and higher lows indicate price compression near the apex.
Technical Indicators to Watch
Look for a volume spike + breakout candle above $0.68 for confirmation.
🔍 Key Resistance & Support Levels
Level Role Reason
$0.72 Major Resistance Previous swing high, rejected 3 times since April 2025
$0.63 Pivot Level Midpoint of the range, near trendline resistance
$0.58 Key Support Base of recent bounce; trendline support
🚀 Bullish Breakout Scenario
If XRP breaks and closes above $0.72 with volume, the next upside targets could be:
A move toward these levels could signal the start of a new macro uptrend, especially if fueled by news (e.g., exchange relistings, Ripple partnerships, or legal clarity).
🧨 Bearish Rejection Scenario
Failure to break $0.68–$0.72 could result in a pullback to:
Watch for increasing bearish volume on rejection to confirm weakness.
Current Market Structure (as of July 2025)
- Price: ~$0.63
- Resistance: $0.68 – $0.72 (multi-week rejection zone)
- Support: $0.56 – $0.58
- Trend: Short-term consolidation in a symmetrical triangle
- Volume: Declining, suggesting a pre-breakout phase
On the daily chart, XRP is forming a symmetrical triangle pattern, a classic consolidation setup that often leads to a breakout when accompanied by rising volume. The lower highs and higher lows indicate price compression near the apex.
Technical Indicators to Watch
- RSI (Relative Strength Index): Currently near 50 on the daily chart—neutral territory. A move above 60 could suggest bullish momentum building.
- MACD (Moving Average Convergence Divergence): Flat, but showing signs of a potential bullish crossover on the 12H chart. A crossover above the zero line would further support bullish continuation.
- Volume Profile: Volume declining during consolidation = textbook pattern before a volatility spike.
Look for a volume spike + breakout candle above $0.68 for confirmation.
🔍 Key Resistance & Support Levels
Level Role Reason
$0.72 Major Resistance Previous swing high, rejected 3 times since April 2025
$0.63 Pivot Level Midpoint of the range, near trendline resistance
$0.58 Key Support Base of recent bounce; trendline support
🚀 Bullish Breakout Scenario
If XRP breaks and closes above $0.72 with volume, the next upside targets could be:
- $0.84 – Minor resistance from September 2023.
- $1.00 psychological level – A key round-number target.
- $1.25–$1.40 – Fib extension from the $0.42–$0.72 range.
A move toward these levels could signal the start of a new macro uptrend, especially if fueled by news (e.g., exchange relistings, Ripple partnerships, or legal clarity).
🧨 Bearish Rejection Scenario
Failure to break $0.68–$0.72 could result in a pullback to:
- $0.58 support
- If broken, next major level = $0.50
Watch for increasing bearish volume on rejection to confirm weakness.
免责声明
这些信息和出版物并不意味着也不构成TradingView提供或认可的金融、投资、交易或其它类型的建议或背书。请在使用条款阅读更多信息。