1H trend chart
-
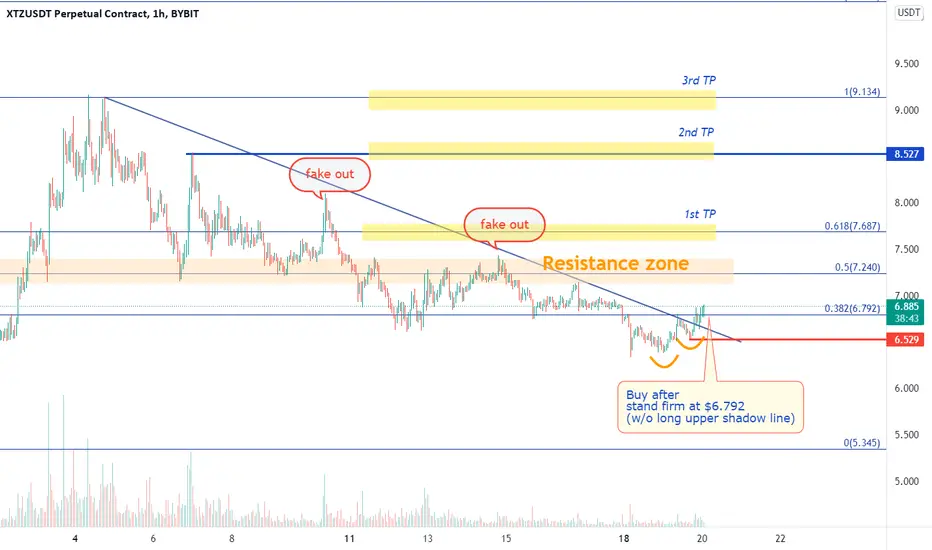
XTZ has been falling due to the upper trend line.
Recently, it eventually broke it out, and can see there is a double bottom.
However, should notice there were lots of fake-out on the way down.(trend line needed to be modified)
So if price can keep standing firm at $6.792(Fib 0.382) in 1H, trading strategy as below.
-
Profit Targets:
a) 7.687----Fib(0.618)
or
7.240(Resistance zone)
b) 8.527----Blue horizontal ray
c) 9.134-----Fib(1)
Stop losses:
a) 6.529-----Red horizontal ray
-
If you like this analysis, smash the "like button" and leave a comment below to share your thoughts
or let me know what crypto you want to see!
Trading is a reflection of yourself. Learn more daily and be ready for every opportunity.
Have a nice trading!
🌔Signal channel: t.me/tradingdiary_cat
🌕Discussion group: t.me/rextalkcrypto
✨Bybit sign up: bybit.com/register?affiliate_id=12787&group_id=36093&group_type=1
💡Sign up through link
→Join Teaching Group for free!(PM me)
🌕Discussion group: t.me/rextalkcrypto
✨Bybit sign up: bybit.com/register?affiliate_id=12787&group_id=36093&group_type=1
💡Sign up through link
→Join Teaching Group for free!(PM me)
相关出版物
免责声明
这些信息和出版物并不意味着也不构成TradingView提供或认可的金融、投资、交易或其它类型的建议或背书。请在使用条款阅读更多信息。