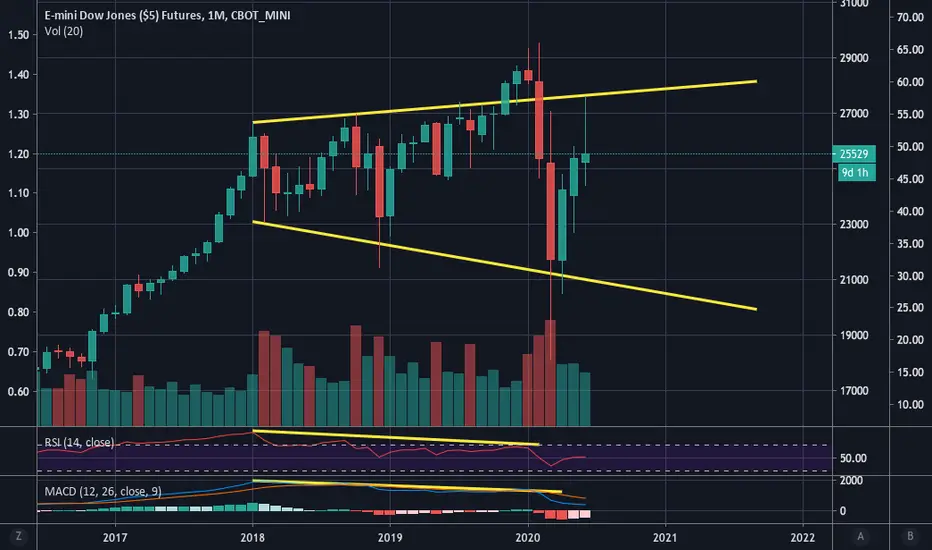
On both the long-term (weekly and monthly) S&P 500 chart and here with the Dow monthly chart, one can see a large megaphone structure or broadening pattern. In both cases, the Fed balance sheet reversal and then repo-induced mania of last year created an overthrow. On the S&P 500 megaphone, this bear market rally culminated in a small overthrow again, but that index now sits once again inside that structure.
With the Dow, on the other hand, the rally came to an abrupt halt as it found resistance at that structure and subsequently retreated from it, to the tick. In this chart, it is forming a very strong, long-wick rejection candle.
I do believe we will be making our way to the bottom channel once again. We will likely find some support there, but I believe it will then fall out of the structure altogether, the common conclusion of a pattern like this.
注释
I forgot to add: notice the multi-year RSI and MACD divergence. Not a good sign.免责声明
这些信息和出版物并非旨在提供,也不构成TradingView提供或认可的任何形式的财务、投资、交易或其他类型的建议或推荐。请阅读使用条款了解更多信息。
免责声明
这些信息和出版物并非旨在提供,也不构成TradingView提供或认可的任何形式的财务、投资、交易或其他类型的建议或推荐。请阅读使用条款了解更多信息。