Levels are marked on the screen and color coded to the timeframe they were created on.
Weekly box is grey and shows the high, low and median range.
The red box is a daily high, low and median from yesterday.
Orange levels are 4hr timeframe
yellow is the hourly timeframe and blue is the 15min timeframe.
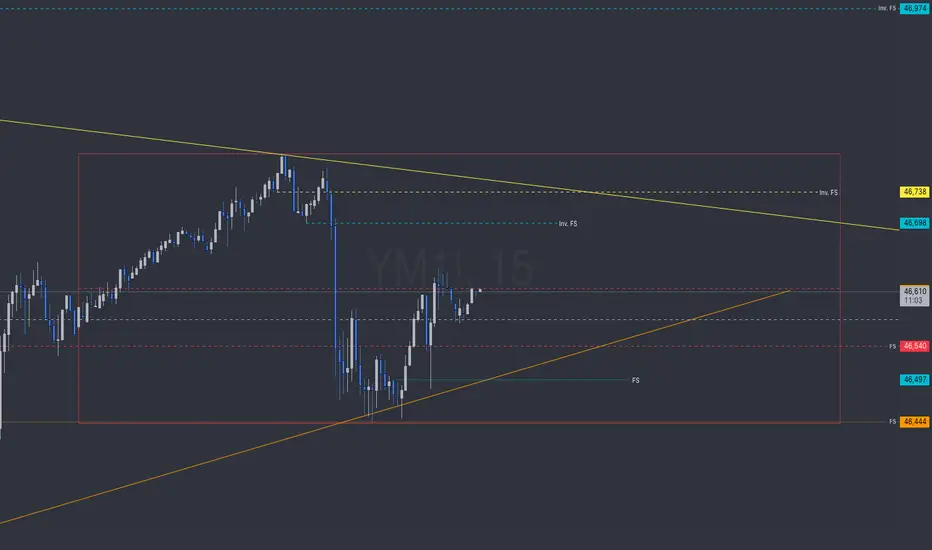
Weekly box is grey and shows the high, low and median range.
The red box is a daily high, low and median from yesterday.
Orange levels are 4hr timeframe
yellow is the hourly timeframe and blue is the 15min timeframe.
免责声明
这些信息和出版物并不意味着也不构成TradingView提供或认可的金融、投资、交易或其它类型的建议或背书。请在使用条款阅读更多信息。
免责声明
这些信息和出版物并不意味着也不构成TradingView提供或认可的金融、投资、交易或其它类型的建议或背书。请在使用条款阅读更多信息。