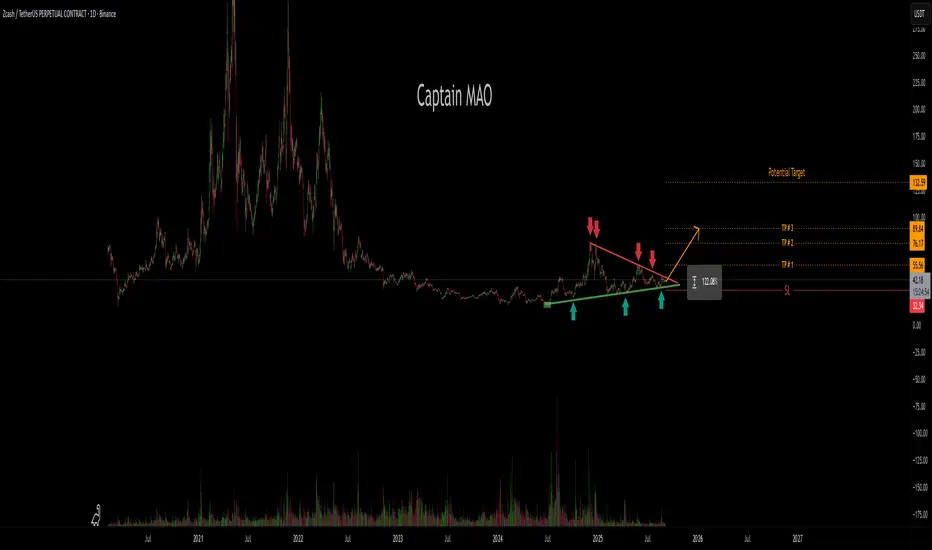
For the past 9+ months, ZEC/USDT has been in a prolonged correction and consolidation phase, forming a huge symmetrical triangle pattern. This structure reflects a balance between buyers and sellers, with volatility compressing as price coils tighter toward the apex of the triangle.
Price action is now approaching a decisive point. According to the 5th-touch breakout rule, the 5th attempt to test trendline support or resistance often results in a make-or-break breakout.
If buyers seize control, a confirmed breakout above the triangle could trigger a powerful expansion move. Conversely, failure to hold the apex level could result in a downside continuation.
🧠 8+ yrs in crypto | ⚡ Scalp & swing trader | 📊 Price action lover | 🎯 Hunting setups daily ✅
免责声明
这些信息和出版物并不意味着也不构成TradingView提供或认可的金融、投资、交易或其它类型的建议或背书。请在使用条款阅读更多信息。
🧠 8+ yrs in crypto | ⚡ Scalp & swing trader | 📊 Price action lover | 🎯 Hunting setups daily ✅
免责声明
这些信息和出版物并不意味着也不构成TradingView提供或认可的金融、投资、交易或其它类型的建议或背书。请在使用条款阅读更多信息。