ZECUSDT – Potential Long Setup at Key Fibonacci Level
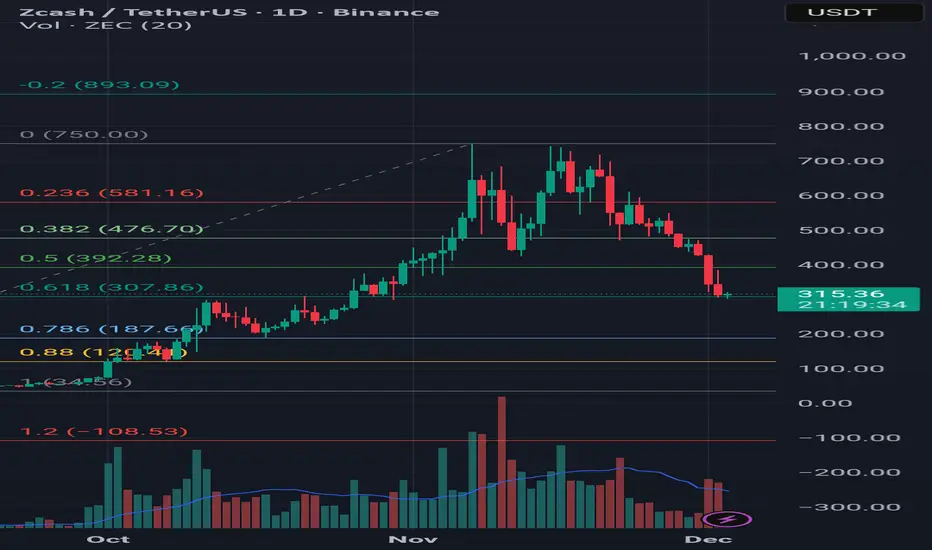
After a strong rally, ZECUSDT has entered a corrective phase, dropping from the 750 zone down to 307.8 – which aligns precisely with the 0.618 Fibonacci retracement level. Historically, this area has acted as a significant resistance twice, and once broken, it led to a notable bullish continuation.
Currently, price action is testing this level again, and given its historical importance, I see potential for a long setup if bullish confirmation appears.
📌 My Targets (TP):
- TP1: 470
- TP2: 658
- TP3: 743
🛡️ Stop Loss: 299
🕒 Timeframe: Daily
📈 Perspective: Long-term
⚠️ Disclaimer: This is not financial advice or a buy/sell signal. Just sharing my personal view based on technical analysis.
免责声明
这些信息和出版物并非旨在提供,也不构成TradingView提供或认可的任何形式的财务、投资、交易或其他类型的建议或推荐。请阅读使用条款了解更多信息。
免责声明
这些信息和出版物并非旨在提供,也不构成TradingView提供或认可的任何形式的财务、投资、交易或其他类型的建议或推荐。请阅读使用条款了解更多信息。