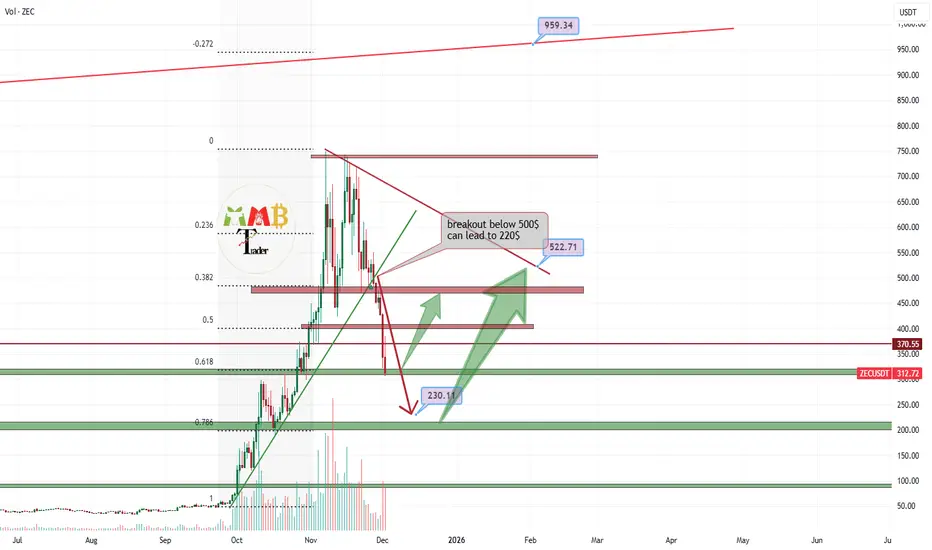
On the ZECUSDT chart, we have observed a decisive breakdown below the key $500 support level, resulting in a decline toward the $300 zone. This level now represents a critical technical confluence, aligning with both a historically significant support area and the 0.618 Fibonacci retracement level.
Given the oversold conditions and the strength of this Fibonacci-support confluence, a technical rebound toward the $500 level—now likely to act as resistance—is plausible. Such a move would be characteristic of a retest of the broken support level, which, if rejected, could result in a continuation of the downtrend. Should the $300 support fail to hold, the next significant structural support would become the primary focus.
DISCLAIMER: ((trade based on your own decision))
<<press like👍 if you enjoy💚
Get Up to $30,000 with deposit & trading at BYBIT+$100 welcome bonus= only with my link now: shorturl.at/JgGFD
My telegram channel: t.me/mmbtchannel
VIP Channels:
Crypto +390% & Forex:+600Pips monthly.
check my telegram for more.
My telegram channel: t.me/mmbtchannel
VIP Channels:
Crypto +390% & Forex:+600Pips monthly.
check my telegram for more.
免责声明
这些信息和出版物并非旨在提供,也不构成TradingView提供或认可的任何形式的财务、投资、交易或其他类型的建议或推荐。请阅读使用条款了解更多信息。