ZENTEC – Technical Outlook; CMP: ₹1467
Based on a comprehensive technical analysis of Zen Technologies Limited (ZENTEC), the stock is currently positioned at a critical juncture, with both Elliott Wave theory and the Bat Harmonic pattern indicating potential trading opportunities.
Elliott Wave Analysis
ZENTEC is trading at ₹1,467 as of October 2, 2025, down from its peak of ₹2,627 (Dec 2024).
The stock has retraced ~69% from its Wave 5 high, reflecting significant corrective pressure.
Price action suggests the stock is in Wave C of an ABC corrective pattern, following the completion of a five-wave impulse sequence.
Bat Harmonic Pattern
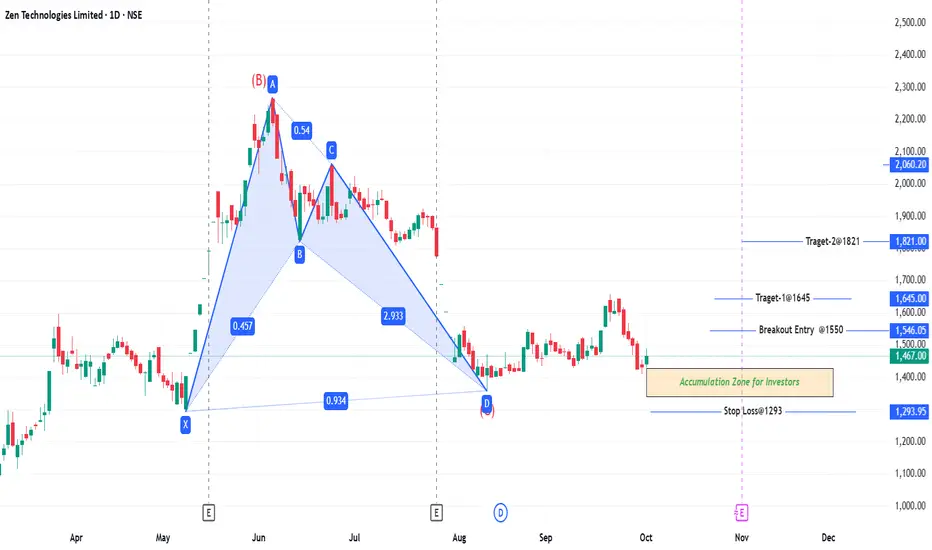
The Bat harmonic pattern is nearing completion with the following structure:
XA Leg: ₹1,293 → ₹2,266 (primary trend)
AB Retracement: 38.2%–50% of XA (completed)
BC Leg: Current position near ₹2,061
CD Target: 88.6% retracement at ₹1,357.06 (Potential Reversal Zone – PRZ)
This alignment suggests that the downside pressure is close to exhaustion, and bottoming out may be near.
Trading Strategy
Buy Zone (Long-Term Investors): ₹1,340 – ₹1,427
Stop Loss: ₹1,293
Aggressive Entry: On confirmed breakout above ₹1,550 (stop loss-1340)
Targets:
T1: ₹1,645
T2: ₹1,821
T3: ₹2,061
📌 Thanks a ton for checking out my idea! Hope it sparked some value for you.
🙏 Follow for more insights
👍 Boost if you found it helpful
✍️ Drop a comment with your thoughts below!
Based on a comprehensive technical analysis of Zen Technologies Limited (ZENTEC), the stock is currently positioned at a critical juncture, with both Elliott Wave theory and the Bat Harmonic pattern indicating potential trading opportunities.
Elliott Wave Analysis
ZENTEC is trading at ₹1,467 as of October 2, 2025, down from its peak of ₹2,627 (Dec 2024).
The stock has retraced ~69% from its Wave 5 high, reflecting significant corrective pressure.
Price action suggests the stock is in Wave C of an ABC corrective pattern, following the completion of a five-wave impulse sequence.
Bat Harmonic Pattern
The Bat harmonic pattern is nearing completion with the following structure:
XA Leg: ₹1,293 → ₹2,266 (primary trend)
AB Retracement: 38.2%–50% of XA (completed)
BC Leg: Current position near ₹2,061
CD Target: 88.6% retracement at ₹1,357.06 (Potential Reversal Zone – PRZ)
This alignment suggests that the downside pressure is close to exhaustion, and bottoming out may be near.
Trading Strategy
Buy Zone (Long-Term Investors): ₹1,340 – ₹1,427
Stop Loss: ₹1,293
Aggressive Entry: On confirmed breakout above ₹1,550 (stop loss-1340)
Targets:
T1: ₹1,645
T2: ₹1,821
T3: ₹2,061
📌 Thanks a ton for checking out my idea! Hope it sparked some value for you.
🙏 Follow for more insights
👍 Boost if you found it helpful
✍️ Drop a comment with your thoughts below!
免责声明
这些信息和出版物并不意味着也不构成TradingView提供或认可的金融、投资、交易或其它类型的建议或背书。请在使用条款阅读更多信息。
免责声明
这些信息和出版物并不意味着也不构成TradingView提供或认可的金融、投资、交易或其它类型的建议或背书。请在使用条款阅读更多信息。