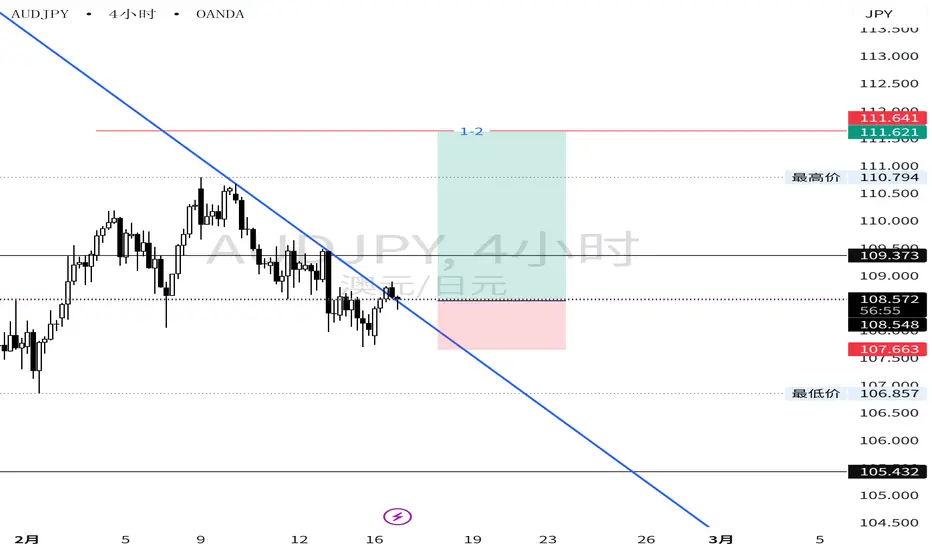
金汇得手:黄金早盘急跌反弹 日线阴阳转换 美元指数昨天收阳,今天关注96.8-97.2区间。
黄金走势如预期,日线阴阳交替出现。如果历史重演,今天应该收阳,要防止行情探底回升。早盘5000附近受阻回落,急跌至4922附近迅速反弹。按照目前走势,今天大概率震荡了。目前关注4960-4970阻力,这个位置不破可以小止损空,一旦有效上坡,还会去日内高点附近,也不排除再去5030。
操作建议:接近日内低点多,接近日内高点空,其他位置参考上面分析。早盘给到4927多单。
原油收长下影阳线,回落62.8多,上方接近64.5空。分析仅供参考,实盘为准。
社区观点


最危险的,是那根大阳线 # 26-2-15|BTC我们经常在市场中看见一些突然增大的k线,很多人害怕错过机会,喜欢追着下单,但是这种追着下单的时候,往往是造成止损最多的订单。
就比如今天的BTC
我们能看出来,经过了一段横盘之后,逐渐走出一段下跌趋势,底部形成一小段反转预警(图中粉色线标记位置),仔细观察会发现一条平缓下降的趋势线1,在a点向上突破。
我们重点讨论一下a这根k线,这是很多散户都喜欢追的一种暴涨形态。a一根k线几乎全是实体,几乎没有影线,这个实体超过了附近所有的阴线阳线大小,突然放大的、夸张的大阳线。
也许你根据之前讲过的理论,会认为这里表示多方的动能非常强劲,不错!多方动能很强,但这个位置我自己在交易中一定会放弃!我们要搞清楚一个概念:动能的强,不代表动能有持续性。
在黄金、BTC、ETH还有一些外汇市场中,经常会遇到一些突发的、没有征兆的波动行情,而且这种行情可能不是震荡,而是某个单向的强势行情。这种极端的走势会让我们从内心产生一种错觉:好像这种强势会持续。但实际上不一定,因为当一根k线突然放大的时候,一般来说是运动非常迅速的,有时候看起来15min的大阳线,很可能在1-3分钟之内就走完了k线大部分的实体区域,在这些区域当中,价格变化非常快,很可能有对手方的订单还没来得及成交,价格已经过去了。
因为不是所有人都会挂被动订单去等着对手主动匹配,市场中总有人手动下单,总有人没有设置自动条件单,当行情迅速变化的时候,这些区域会出现很多潜在订单,没来得及成交就已经错过了。这种时候,往往会形成新的某种市场合力,行情会有一种动能去填补这些订单稀少的区域,即便是会继续这里的单向行情。
注意,这就是FVG的核心原理,那我们再看到今天BTC的这个例子中,a迅速向上移动,中间就有可能存在没来得及卖出的潜在空单,这里价格移动过快,也有可能过度透支了多方动能,之后有可能会产生回调。
这就是我前面说的:动能的强,不代表动能有持续性。如果这里回调了而且继续向下,那a点就是一个假突破,而且在更高周期图里,a点和之后的k线会组成一个影线朝上的pinbar形态。但我们在盘面上看见的结果,是a点之后行情迅速回调,曾经被打压到了非常接近a点最低价的位置,但之后多头再次发力,把行情继续推上去。这是事后看见的结果,但如果处在当时的盘面中,我们并不能精确预测这种走势,而当时的盘面由于大阳线带来的“突兀”感,会让市场充满更多的不确定。
因此越是这种突兀的区域,不确定因素越大,所以这是我会放弃的入场点,尽管行情很诱人,我还是要保持冷静和理智,这种大行情,后面带来的很可能是一个陷阱。
随后我们可以看见一段横盘,也就是标记2的区域,我们注意到这里有顶部的蓝色预警线,但是画不出上涨的趋势线,因此无法用趋势线的理论进行分析。(每一种理论总会有失效的时候,这很正常)
之后我们看见了一段趋势线3,是一条明显的上涨趋势,在顶部经历一个小实体阴线之后,后面接了一个实体变大的阴线,向下突破了趋势线3,这里就是一个多转空的结构转换。选择在这里入场,和a点相比,碰上极端反转的概率更小,止损空间更小,行情向我们期望的方向发展的概率也更大。
我们从结果能看出来,选择在趋势线3的突破位置入场,带给我们的止盈空间,和a点相比并不会低,反而比a点更多。如果在a点判断入场,止损空间大,行情不确定性高,还不确定这里多头的持续性如何,随时有可能发生一个反转。
所以不要看见大行情来了就激动,随时保持理智的思维,大行情很可能是一个坑,反而那些不起眼的、经过逻辑推断和市场验证的结构转换,往往能带给我们更确定的方向,和更稳健的交易,而且后面很可能还有意外惊喜。

XAUUSD 流动性比方向更重要市场背景
OANDA:XAUUSD 正在经历一个纠正阶段,经过急剧的位移,价格在明显定义的流动性池之间旋转。高时间框架的偏向依然保持,但短期的流动性现在变得选择性和反应性。
当前观察
🔍 卖盘提供了干净的扩展,随后出现了结构性反应,表明参与而非持续。价格在中点下方的接受表明平衡而非紧迫。
关键区域
🔴 卖方兴趣:
5095 – 5097
该区域与高价位和之前的反应高点相一致。这里的任何互动都将被监测以观察分发行为,而非突破接受。
失效点:5105
🟢 买方反应区:
4927 – 4925
当前范围结构内的折扣区。关注如果再次测试时反应的质量,尤其是在卖方交付之后。
失效点:4920
前瞻意识
注意力仍然集中在价格在范围极端的表现上,反应和跟进比方向更重要。在流动性被重新分配时,需要耐心。


以太坊日更 2月16日
ETH 2月16日 1小时图
1791看多到2966
昨天说了2100附近有阻力
正式突破后下个目标2496
以btc调整结束信号为准
eth超跌btc很多且跌破趋势线不容乐观
逢低做多!


没有基本面助力先看震荡,美国不打等以色列先动手1、美国国土安全部于周六凌晨开始停摆
2、印度空军拟增购 114 架法国“阵风”(Rafale)战斗机,但目前还处在前置批准阶段
3、特朗普称伊朗政权更迭可能是“最好的事情”,此时第二艘航母正驶往中东
5100上破需要基本面助力,没有基本面助力先看震荡
5050-5060 是个暂时分水岭,越过看5100
关键美伊局势,美国不打就是等以色列先动手,毕竟硬刚哪有捡漏好

制造商能否成为人工智能的脊梁?伊顿公司(Eaton Corporation plc,纽交所代码:ETN)策划了现代工业史上最引人注目的战略重塑之一。伊顿曾被归类为制造液压系统和卡车变速箱的多元化周期性制造商,如今已系统地将自己重新定位为处于人工智能(AI)革命和全球能源转型核心的“智能动力管理”实体。这种蜕变并非偶然;这是削减传统业务、加倍投入电气基础设施以及开拓 800V 直流架构和固态断路器等技术的深思熟虑的结果,这些技术是为超大规模 AI 数据中心和脱碳电网供电的先决条件。这一转型的核心资产是该公司的美洲电气部门(Electrical Americas),其在 2025 年第三季度报告了惊人的 30.3% 的营业利润率,这一数字通常属于软件公司而非硬件制造商。
支撑这一转型的财务表现同样令人信服。对于 2025 全年,伊顿指引调整后每股收益(EPS)在 11.80 美元至 12.20 美元之间,代表着在早已创纪录的 2024 年水平上实现了两位数的增长,而第三季度的有机增长加速至 7%,主要由销量而非单纯的价格通胀驱动。展望 2026 年,管理层发布的指引为 7-9% 的有机增长和 13.00 美元至 13.50 美元的调整后每股收益。美洲电气部门创纪录且迅速扩大的积压订单(同比增长 20%)提供了极佳的未来收入可见性。市场也做出了相应的反应:伊顿目前的市盈率约为 37 倍,与其历史上 15-20 倍的工业倍数相比有了深刻的估值重估,这反映了其与 Vertiv 等同行一道重新定位为技术赋能者类别。
然而,在伊顿目前的高度,机遇与风险密不可分。即将于 2026 年进行的移动出行集团(Mobility Group)分拆——旨在通过将高增长的电气业务从周期性汽车部门的拖累中解放出来以通过“倍数套利”释放价值——是长达十年的投资组合改革的顶峰,尽管它带来了短期的执行复杂性。在地缘政治方面,伊顿受益于特朗普时代关税制度下的“北美堡垒”制造优势,同时也面临供应链脆弱性的风险,以及如果贸易战抑制私人资本支出可能导致的利润率压缩风险。首席执行官一职从“架构师”Craig Arnold 过渡到“运营者”Paulo Ruiz 标志着连续性,但“新伊顿”仍必须在极高的期望下实现完美的执行。对于成熟的投资者来说,伊顿代表了一个罕见的主张:关键基础设施的防御性耐用性与 AI 和能源超级周期的长期增长动力相结合——虽以完美定价,却植根于不可替代的物理学。


The Dangerous Candle: The Large Bullish ExpansionWe often see suddenly expanded candles in the market. Many traders fear missing out and rush to enter on these explosive moves.
However, these impulsive entries are often the ones that get stopped out the most.
Take today’s BTC as an example.
After a period of consolidation, price gradually formed a short-term downtrend. At the bottom, a small reversal warning appeared (marked by the pink line in the chart). If we observe carefully, we can draw a gently descending trendline (Trendline 1), which was broken upward at point A.
Let’s focus on candle A.
This is the type of explosive bullish candle many retail traders love to chase. The candle is almost entirely body, with barely any wicks. Its size exceeds all nearby candles — a sudden, exaggerated expansion.
Based on theory, you might conclude that bullish momentum here is extremely strong. And that’s true — momentum is strong.
But in my own trading, this is exactly the kind of setup I would avoid.
We need to understand one key concept:
Strong momentum does not necessarily mean sustainable momentum.
In markets like Gold, BTC, ETH, and forex, we often see sudden, unexpected volatility. Sometimes it’s not just noise — it becomes a strong one-sided move. These extreme moves create a psychological illusion that the strength will continue.
But that is not always the case.
When a candle suddenly expands, the movement is usually very fast. What appears to be a 15-minute bullish candle may have completed most of its body within just 1–3 minutes. During that rapid move, price changes so quickly that many opposing orders may not have had time to get filled before price has already moved away.
Not everyone places passive limit orders waiting to be matched. Some traders execute manually, some do not use conditional orders. When price moves too quickly, certain price areas may contain many unfilled or skipped orders.
This often leads to a new kind of market imbalance. Price may later revisit those thin-liquidity areas to rebalance orders — even if the broader trend continues afterward.
This is essentially the core logic behind FVG (Fair Value Gap).
In today’s BTC example, price at point A surged upward rapidly. There may have been unfilled sell orders left behind. The move could also have overextended bullish momentum, increasing the probability of a pullback.
Again:
Strong momentum does not guarantee continuation.
If price had pulled back and continued downward, point A would have become a false breakout. On a higher timeframe, A and the following candles might even form a pin bar with an upper wick.
In reality, what happened afterward was this:
Price pulled back sharply, almost returning to the low of candle A, but then bulls regained control and pushed price higher again.
That is what we see in hindsight.
But in live market conditions, we cannot precisely predict such outcomes. The “abrupt” nature of that large candle introduces greater uncertainty into the market.
The more abrupt the movement, the greater the uncertainty.
That is why I would avoid entering at point A. Even though the move looks attractive, discipline and rational thinking are more important. Large impulsive moves often hide traps.
Next, we observe a consolidation zone (Area 2). There was a blue top warning signal, but no valid upward trendline could be drawn. Therefore, trendline theory could not be applied here. (Every method has situations where it does not work — that is normal.)
Later, we see Trendline 3, a clear upward structure. After a small bearish candle near the top, it was followed by a larger bearish candle breaking below Trendline 3.
This marks a structural shift from bullish to bearish.
Entering at this structural break, compared to point A:
Lower probability of extreme reversal
Smaller stop-loss distance
Higher probability of price moving in the expected direction
From the outcome, we can see that entering at the break of Trendline 3 provided at least as much profit potential as chasing at point A — in fact, even more.
If you had entered at A:
Larger stop-loss
Higher uncertainty
Questionable sustainability of bullish strength
Constant risk of reversal
So don’t get overly excited when you see a large move.
Stay rational.
Big moves are often traps.
On the other hand, the seemingly less dramatic structural shifts — those confirmed by logic and market validation — often provide clearer direction, more stable trades, and sometimes even unexpected rewards.


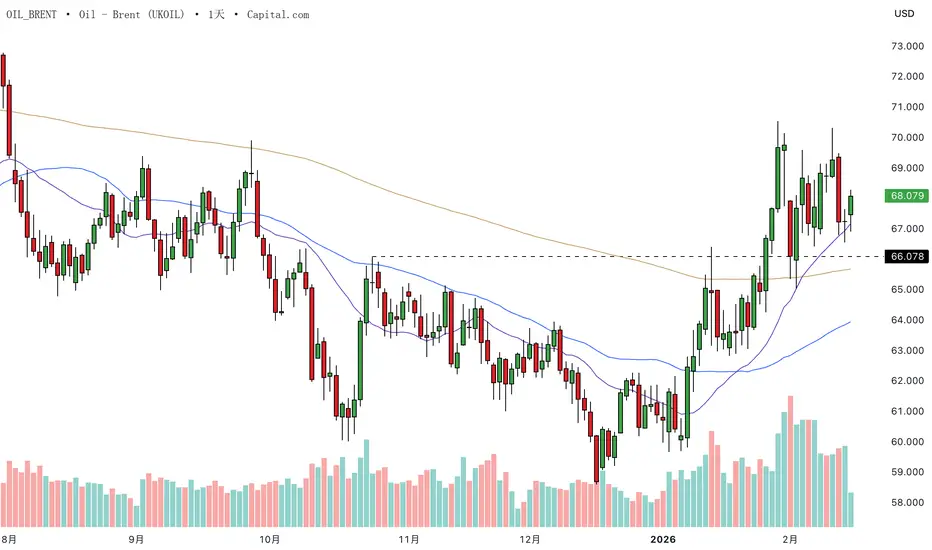
在基本面分歧下,原油走势开始转变在自低点强劲反弹之后,原油的价格行为正出现值得短线交易者关注的变化。原本相对单边顺畅的趋势行情,开始转为双向拉锯。当市场性质发生这种转变时,无论是交易预期还是执行策略,都需要同步调整。
夹在两种叙事之间的市场
最新的 OPEC 与 IEA 报告,再次凸显供给面基本面的分歧。
OPEC 的数据显示,短期内仅有小幅供给过剩,甚至暗示若产量维持当前水平,全年供需可能趋于紧平衡;然而 IEA 则持续指出全球过剩幅度更大,并预计需求增长放缓。两个具权威性的机构,却得出明显不同的结论。
再加上 3 月 1 日即将召开的 OPEC+ 会议,产油国将决定是否恢复增产。在供给叙事尚未明确指向单一方向之前,市场信心自然下降。当基本面缺乏清晰主线时,行情往往不再延续趋势,而是进入反复消化与区间拉锯的阶段,而这种转变,已逐渐反映在技术面上。
从趋势行情转向区间震荡
在交易中,及早识别市场状态的转换,是相当关键的能力,因为它会影响后续所有交易决策。
自年初以来,原油大致呈现趋势型态运行,“逢回做多”策略效果良好,行情延续性也相对干净。然而近几周,市场结构开始出现变化,逐步由趋势转为区间震荡。
上周的价格行为可能是一个重要转折点。当价格反弹至前波摆动高点附近时,未能延续上攻,反而回落并形成明确的较低摆动高点(lower swing high)。这通常是趋势动能减弱的第一个结构性信号,也暗示市场开始接受更宽广的双向波动区间。
切换至小时图观察,更能强化这一解读。此前回调往往迅速被买盘承接并延续上行,如今价格走势则明显转为来回震荡:反弹遭遇卖压、回落出现买盘。这种从“延伸型走势”转为“均值回归型波动”的转变,正是市场由趋势转向区间的典型过程,也与当前基本面分歧加剧的背景相呼应。
UKOIL 日线图
过往表现并不代表未来结果
UKOIL 小时图
过往表现并不代表未来结果
免责声明:
本内容仅供信息与学习用途,不构成任何投资建议,亦未考虑任何投资者的个别财务状况或投资目标。文中如提及过往表现,并不构成对未来结果或业绩的保证或可靠指标。社交媒体渠道不适用于英国居民。
The Market Is Not a Prediction Game — It Is a Conditional SystemThe Market Is Not a Prediction Game — It Is a Conditional System
Most traders approach the market as a prediction problem.
They try to answer one question:
Where will price go next?
But this question is fundamentally flawed.
The market is not a forecasting puzzle.
It is a dynamic conditional system.
1️⃣ Prediction Assumes Certainty
Prediction thinking assumes:
The future can be estimated
Direction can be forecast
Accuracy determines profitability
This mindset creates a hidden trap:
The more you try to predict,
the more you feel responsible for being right.
And when you're wrong,
you react emotionally.
2️⃣ Markets Operate Through Conditions, Not Certainty
Markets evolve through:
Structural transitions
State changes
Participation shifts
Not through linear projection.
A trend continues if structure holds.
A transition begins if structure weakens.
A breakout matters if follow-through confirms.
Everything is conditional.
Nothing is guaranteed.
3️⃣ The Real Question Is Different
Instead of asking:
Where will price go?
A more stable question is:
Under what conditions does continuation remain valid?
This shifts focus from outcome
to structure.
From guessing
to observing.
From predicting
to filtering.
4️⃣ Why This Matters
Most trading mistakes do not come from bad entries.
They come from:
Acting without structural confirmation
Treating noise as opportunity
Forcing conviction where conditions are unclear
When you treat the market as a prediction game,
you increase emotional volatility.
When you treat it as a conditional system,
you reduce decision instability.
5️⃣ Final Thought
The market does not reward those who guess correctly.
It rewards those who:
Wait for valid conditions
Accept invalidation quickly
Adapt when structure changes
Prediction seeks certainty.
Structure manages uncertainty.
And uncertainty is the natural state of markets.
UIA Insight Series
Market Reality — Layer 1
