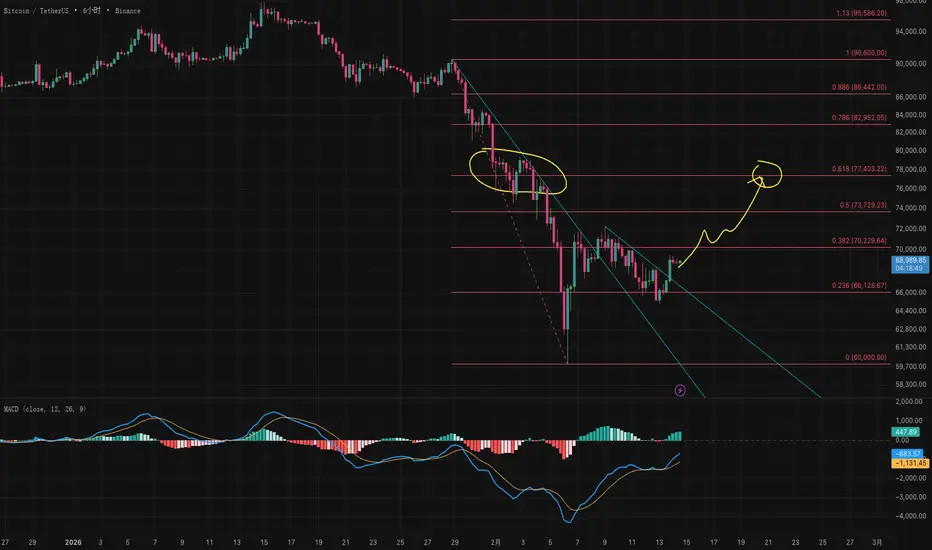
最危险的,是那根大阳线 # 26-2-15|BTC我们经常在市场中看见一些突然增大的k线,很多人害怕错过机会,喜欢追着下单,但是这种追着下单的时候,往往是造成止损最多的订单。
就比如今天的BTC
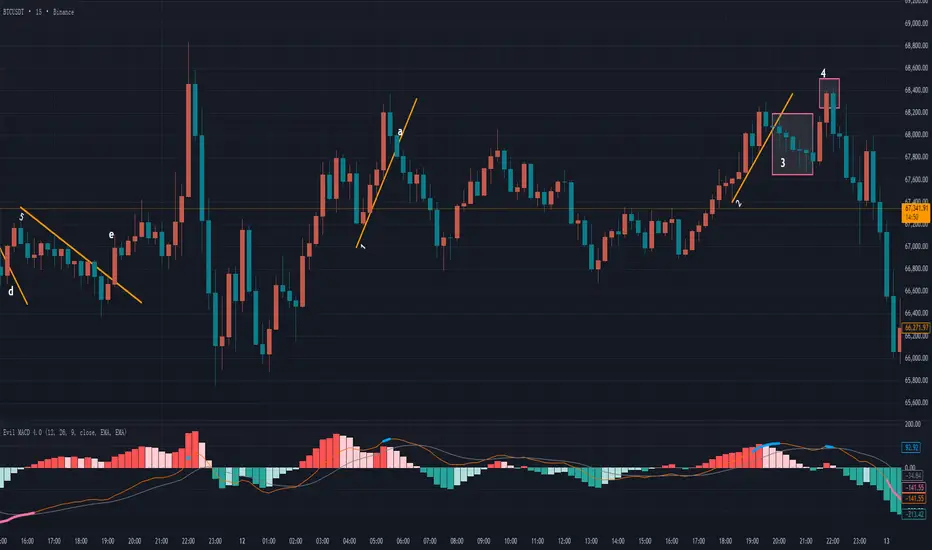
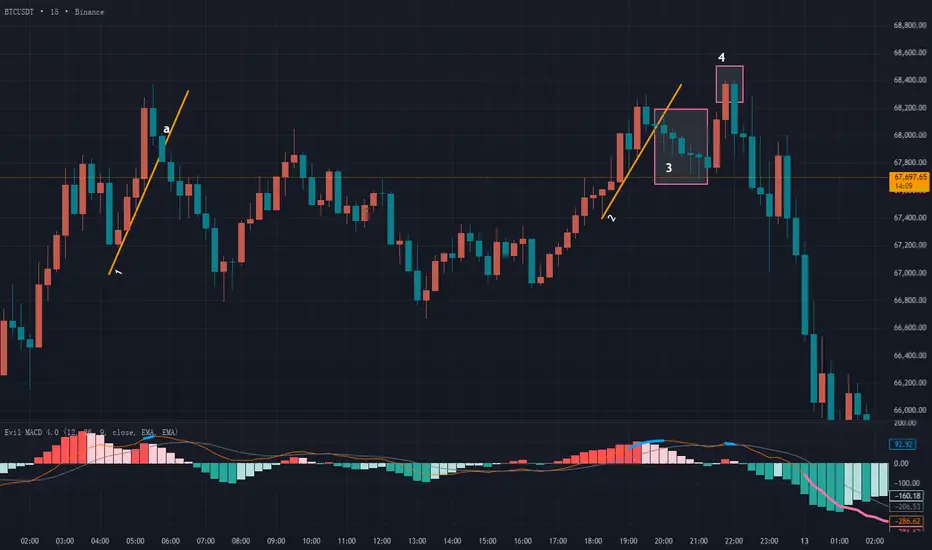
我们能看出来,经过了一段横盘之后,逐渐走出一段下跌趋势,底部形成一小段反转预警(图中粉色线标记位置),仔细观察会发现一条平缓下降的趋势线1,在a点向上突破。
我们重点讨论一下a这根k线,这是很多散户都喜欢追的一种暴涨形态。a一根k线几乎全是实体,几乎没有影线,这个实体超过了附近所有的阴线阳线大小,突然放大的、夸张的大阳线。
也许你根据之前讲过的理论,会认为这里表示多方的动能非常强劲,不错!多方动能很强,但这个位置我自己在交易中一定会放弃!我们要搞清楚一个概念:动能的强,不代表动能有持续性。
在黄金、BTC、ETH还有一些外汇市场中,经常会遇到一些突发的、没有征兆的波动行情,而且这种行情可能不是震荡,而是某个单向的强势行情。这种极端的走势会让我们从内心产生一种错觉:好像这种强势会持续。但实际上不一定,因为当一根k线突然放大的时候,一般来说是运动非常迅速的,有时候看起来15min的大阳线,很可能在1-3分钟之内就走完了k线大部分的实体区域,在这些区域当中,价格变化非常快,很可能有对手方的订单还没来得及成交,价格已经过去了。
因为不是所有人都会挂被动订单去等着对手主动匹配,市场中总有人手动下单,总有人没有设置自动条件单,当行情迅速变化的时候,这些区域会出现很多潜在订单,没来得及成交就已经错过了。这种时候,往往会形成新的某种市场合力,行情会有一种动能去填补这些订单稀少的区域,即便是会继续这里的单向行情。
注意,这就是FVG的核心原理,那我们再看到今天BTC的这个例子中,a迅速向上移动,中间就有可能存在没来得及卖出的潜在空单,这里价格移动过快,也有可能过度透支了多方动能,之后有可能会产生回调。
这就是我前面说的:动能的强,不代表动能有持续性。如果这里回调了而且继续向下,那a点就是一个假突破,而且在更高周期图里,a点和之后的k线会组成一个影线朝上的pinbar形态。但我们在盘面上看见的结果,是a点之后行情迅速回调,曾经被打压到了非常接近a点最低价的位置,但之后多头再次发力,把行情继续推上去。这是事后看见的结果,但如果处在当时的盘面中,我们并不能精确预测这种走势,而当时的盘面由于大阳线带来的“突兀”感,会让市场充满更多的不确定。
因此越是这种突兀的区域,不确定因素越大,所以这是我会放弃的入场点,尽管行情很诱人,我还是要保持冷静和理智,这种大行情,后面带来的很可能是一个陷阱。
随后我们可以看见一段横盘,也就是标记2的区域,我们注意到这里有顶部的蓝色预警线,但是画不出上涨的趋势线,因此无法用趋势线的理论进行分析。(每一种理论总会有失效的时候,这很正常)
之后我们看见了一段趋势线3,是一条明显的上涨趋势,在顶部经历一个小实体阴线之后,后面接了一个实体变大的阴线,向下突破了趋势线3,这里就是一个多转空的结构转换。选择在这里入场,和a点相比,碰上极端反转的概率更小,止损空间更小,行情向我们期望的方向发展的概率也更大。
我们从结果能看出来,选择在趋势线3的突破位置入场,带给我们的止盈空间,和a点相比并不会低,反而比a点更多。如果在a点判断入场,止损空间大,行情不确定性高,还不确定这里多头的持续性如何,随时有可能发生一个反转。
所以不要看见大行情来了就激动,随时保持理智的思维,大行情很可能是一个坑,反而那些不起眼的、经过逻辑推断和市场验证的结构转换,往往能带给我们更确定的方向,和更稳健的交易,而且后面很可能还有意外惊喜。
图表形态

市场合力的形成:点火与跟风 # 26-2-14|BTC
首先我们可以看见一大段蓝色预警,代表潜在顶部,然后形成了一条趋势线1,而且这是一条经过验证的趋势线,由d点向下突破,但我们要注意这里突破k线本身,是一根接近十字星的形态,实体占比非常小,带有很长的下影线,而且d点之后马上反弹,这里是不能判断有效的多转空的。
之后的上涨形成了趋势线2,同样也经过了市场的验证,而且在e点向下突破,我们注意到e点是实体为主,影线可以忽略不计,这里可以判断出一个多转空的结构转换。
那今天最关键的问题就来了:如果这里空单入场,我们看不出止盈空间。这就涉及到今天要讲的重要概念:市场合力的点火与跟风。
市场上有很多交易员,有不同规模的散户,也有资金量非常大的机构、公司,资金规模大的这些机构也并不一定是受到某一个观点的统一影响,大家有可能存在不同的意见,所以我们能看出盘面上一版都处于一种无序的震荡行情当中,没有清晰的方向。
但是也会形成某一段突然的加速上涨或下跌,在小流通值的品种当中,这种某一个方向的行为的确有可能是某一个大型“操盘手”引起的,但如果是BTC、XAU或是外汇这种大流通值的品种呢?单个机构对于这么大市场的影响是可以忽略不计的,因此在这些大流通值的品种里,某一方向的行情可以理解为一种“市场合力”,也就是代表大多数交易员认可的方向,才会导致有一方的主动订单不断吃掉另一方的被动挂单,从而引起价格迅速向某一方移动。
反转的时候,也并不是直接来一个干脆的掉头,而是有一部分反向力量开始发力,做出一个“测试”,我们可以把这种行为理解成“点火”的动作,点完火之后,我们看一下这把火能不能烧起来,如果烧不起来,说明现在条件不佳,可以再等等。
大家在盘面上看见的一些假突破、插针、欺骗行为,很可能都是这里讨论的“点火”动作。为什么要存在点火?因为市值大的品种,如果要真的操盘,会付出极高的成本,因为需要大量的主动订单去吃掉被动挂单,还要对付在这个过程中新挂出来的被动订单,这个成本是很多机构都无法承担的。
这里的e点,我们就可以理解为一部分空方势力的“点火”动作,测试一下这里有没有到那个大家都认可的临界点。点火之后,市场会不会像链式反应一样一触即发,大家纷纷揭竿而起站队空方,形成一波流畅下跌,那我在这里的点火就成为了空方成本最低的一个点。
f的出现,代表了市场上多数人并不认可这种想法。f下影线很长,说明这里出现过一部分空方力量,曾经把价格推到了f的最低价位置,但是出现问题了,到了f最低点之后空方力量衰竭了,被反向的多方力量推到了收线价格位置,甚至形成了十字星的小阳线,这里说明“点火”之后没有人跟风了。
市场是永远充满未知的,随时有可能出现反转,用这种“点火”和“跟风”的方式去看待市场,我们就可以理解很多行为了。
这里如果在e点选择了空方入场点,那看见f之后也应该马上意识到点火之后出了问题,及时出场,这里产生的亏损并不大,非常接近成本线,这就是一种灵活的、科学的风险控制方法,这种分析思路也来自于《威科夫操盘法》这一经典理论,“点火”和“跟风”是我加入了一些自己对市场的理解和思考。
同样的事情发生在趋势线3之后,但趋势线3本身是没有经过市场验证的,所以这里的反转确定性本身是更低的。随后我们可以看见在g有一个实体阴线向下突破,但看这里的阴线,可以判断一个多转空信号,也就是发生了一部分空方力量的“点火”动作。
随后我们看见k这里直接一个阳线反包回去,而且仔细对比发现,k的实体超过了g,说明点火之后不仅没出现跟风的力量,反而被多方强势压制,这就说明这里的空方合力不够强大,现在很难形成有效的空方持续性,因此出现k之后,也应该警惕起来,及时止损,即便还没到止损线,在k点之后的几个小阴线,都看不出很强的空方动能,印证了前面的假设:空方缺乏力度。所以在这里最接近成本线的位置,应该判断止损小亏出局。
然后我们可以看见另一段趋势线4,而且在n点向下突破,这里也满足我们判断多转空的逻辑:蓝线预警信号、形成趋势线、趋势线被反向突破。显然,根据上面的描述,n点也属于一个空方的“点火”动作,但这里我们能明显看出之后有“跟风”,产生了更大的阴线,说明市场上有更多的交易员、机构接受了这里空方的“点火”动作,选择支持空方,于是这里形成了一波市场合力,方向是空方。
我在之前的分析里说过一句话:“我们要做的是在概率最大的位置选择跟随市场合力,但市场合力能带我们走多远,需要一点运气”。这句话的意思就是,我们可以从盘面的客观信息里看出这种“点火”动作,但点火之后是否存在“跟风”行为?我们是无法预测的,但一般在这种位置判断入场,会给到我们概率优势和盈亏比优势,因为一旦形成市场合力,会经历迅速的、大幅度的浮盈,就比如今天BTC的行情,判断的市场合力点有3个,前两个属于点火之后没有跟风,有一个是点火之后出现了空方的跟风行为,但这一个正确的入场点,止盈会盖住前面两个入场点带来的止损。
理解了这种点火与跟风的逻辑,还有市场合力的原理,你会发现对市场和行情的理解更深入,更接近本质。


在基本面分歧下,原油走势开始转变在自低点强劲反弹之后,原油的价格行为正出现值得短线交易者关注的变化。原本相对单边顺畅的趋势行情,开始转为双向拉锯。当市场性质发生这种转变时,无论是交易预期还是执行策略,都需要同步调整。
夹在两种叙事之间的市场
最新的 OPEC 与 IEA 报告,再次凸显供给面基本面的分歧。
OPEC 的数据显示,短期内仅有小幅供给过剩,甚至暗示若产量维持当前水平,全年供需可能趋于紧平衡;然而 IEA 则持续指出全球过剩幅度更大,并预计需求增长放缓。两个具权威性的机构,却得出明显不同的结论。
再加上 3 月 1 日即将召开的 OPEC+ 会议,产油国将决定是否恢复增产。在供给叙事尚未明确指向单一方向之前,市场信心自然下降。当基本面缺乏清晰主线时,行情往往不再延续趋势,而是进入反复消化与区间拉锯的阶段,而这种转变,已逐渐反映在技术面上。
从趋势行情转向区间震荡
在交易中,及早识别市场状态的转换,是相当关键的能力,因为它会影响后续所有交易决策。
自年初以来,原油大致呈现趋势型态运行,“逢回做多”策略效果良好,行情延续性也相对干净。然而近几周,市场结构开始出现变化,逐步由趋势转为区间震荡。
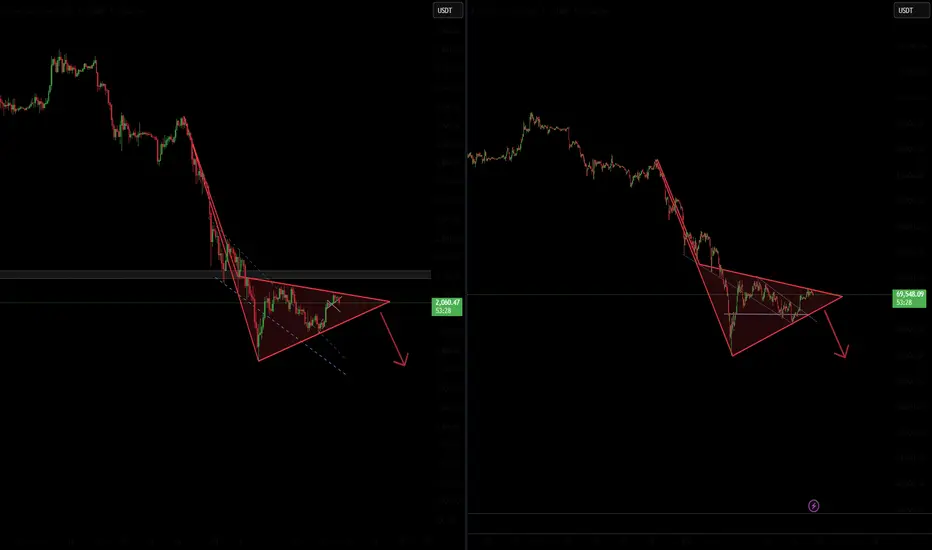
上周的价格行为可能是一个重要转折点。当价格反弹至前波摆动高点附近时,未能延续上攻,反而回落并形成明确的较低摆动高点(lower swing high)。这通常是趋势动能减弱的第一个结构性信号,也暗示市场开始接受更宽广的双向波动区间。
切换至小时图观察,更能强化这一解读。此前回调往往迅速被买盘承接并延续上行,如今价格走势则明显转为来回震荡:反弹遭遇卖压、回落出现买盘。这种从“延伸型走势”转为“均值回归型波动”的转变,正是市场由趋势转向区间的典型过程,也与当前基本面分歧加剧的背景相呼应。
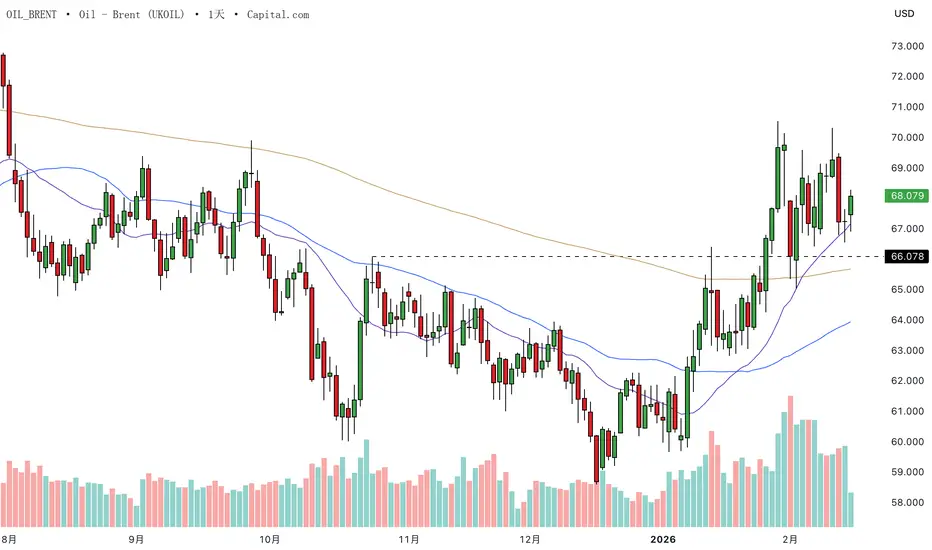
UKOIL 日线图
过往表现并不代表未来结果
UKOIL 小时图
过往表现并不代表未来结果
免责声明:
本内容仅供信息与学习用途,不构成任何投资建议,亦未考虑任何投资者的个别财务状况或投资目标。文中如提及过往表现,并不构成对未来结果或业绩的保证或可靠指标。社交媒体渠道不适用于英国居民。
盛航股份行情备忘录技术面分析:横盘筑底与压力测试
价格区间与支撑: 股价目前在 16.11元 附近,正处于一个长达数月的箱体底部。图中标记的黄色区域构成了极强的心理和技术支撑位。近期股价多次回踩这一区间均能企稳,说明下方买盘意愿较强。
上方压力: 短期第一阻力位在 16.56元(图中黄色实线),这是目前尝试突破的“颈线”。一旦放量突破,目标将指向 18.12元 和 19.67元。
成交量观察: ,近期处于缩量震荡状态。这通常意味着抛盘已基本枯竭,市场正在等待一个触发点(如政策利好或业绩拐点)来启动行情。
基本面背景:阵痛期后的修复
业绩承压: 2025年三季报显示公司净利润同比下滑约 49%。这解释了为什么股价在2025年下半年经历了深幅调整。目前股价已充分计价了这一利空。
核心竞争力: 盛航作为国内危化品水路运输的头部企业,其船队规模和资质护城河依然稳固。2026年初的市场调研显示,内贸化学品船运价已触底反弹,行业景气度正缓慢复苏。
转型预期: 公司正在向“智慧航运”转型,并积极布局国际市场。这种基本面逻辑的切换往往需要时间在二级市场反映。
后续走势预测
短期预测(两周内): 极大概率维持在 15.80 - 16.50元 之间小幅震荡。由于目前正处于 A 股整体环境较好的 2026 年初,该股有补涨需求。
中期预测(一季度):
乐观情况: 若能带量突破 16.56元,股价将进入快速修复通道,挑战 18.00元 上方。
悲观情况: 若跌破 15.00元 强支撑,则说明基本面出现了未披露的进一步恶化,需止损离场。但从目前 A 股整体指数站上十年高位的背景来看,这种概率较低。
声明:
这是记录,不是预言,仅用于个人复盘、推演,请独立思考,切勿盲目实盘。
保持怀疑,我会打脸。 我的判断经常出错,这是常态。如果你发现我错了,那大概率是真的错了。请带着批判的眼光看一切。
投资有风险,入市需谨慎。

XAUUSD 流动性比方向更重要市场背景
OANDA:XAUUSD 正在经历一个纠正阶段,经过急剧的位移,价格在明显定义的流动性池之间旋转。高时间框架的偏向依然保持,但短期的流动性现在变得选择性和反应性。
当前观察
🔍 卖盘提供了干净的扩展,随后出现了结构性反应,表明参与而非持续。价格在中点下方的接受表明平衡而非紧迫。
关键区域
🔴 卖方兴趣:
5095 – 5097
该区域与高价位和之前的反应高点相一致。这里的任何互动都将被监测以观察分发行为,而非突破接受。
失效点:5105
🟢 买方反应区:
4927 – 4925
当前范围结构内的折扣区。关注如果再次测试时反应的质量,尤其是在卖方交付之后。
失效点:4920
前瞻意识
注意力仍然集中在价格在范围极端的表现上,反应和跟进比方向更重要。在流动性被重新分配时,需要耐心。


结构量化与狙击式交易 # 26-2-13|BTC · ETH · 黄金1 BTC
今天刚开始就是一段流畅的下跌趋势,而且走势稍微复杂一些,我们仔细拆解了分析。
首先能画出一条趋势线1,注意这是一条刚形成的趋势线,没有经过市场验证,具体表现为a点之前的k线并没有验证到趋势线的位置,而是中间产生了一段空间距离。之后由a点向上突破,而且a点的实体为主,没有很长的上下影线,这里属于满足硬性条件,但质量欠佳的反转位置,趋势线没经过验证,a点突破并不算明显超出趋势线,比较接近,所以这里也取决于自己的风险偏好,激进型可以判断反转,稳健型也可以再等等。
在a点突破失败之后,产生了另一条趋势线2的走势,我们会发现2是经过了市场检验的,因此2的质量高于a,且由b点向上突破,仔细观察发现,b点虽然有上影线,但影线长度其实略低于实体,所以质量还算及格,风险能接受,这里可以判断一个结构反转。
经过短暂的上涨之后,再一次产生一段回调,并形成了趋势线3,我们注意到趋势线3同样经过了市场的验证,而且由c点向上突破,c是一条完全实体的阳线,没有影线,而且明显脱离了趋势线,和a、b两个点相比,c点是展现出多方动能最强的位置。
我们对比abc三个突破点的具体细节:
a - 趋势线未验证,实体占比70%,略微突破趋势线
b - 趋势线有验证,实体占比60%,略微突破趋势线
c - 趋势线有验证,实体占比100%,明显突破趋势线
这三个点当中哪一个最好,这样对比之下一目了然。有很多人在交易中不做这样的分析和对比,判断入场点经常是基于情绪和主观判断,但我们面对的是一个客观的市场,你的主观想法市场不一定认可,但市场中客观表现出来的现象,可以推导出某种导致现象产生的原因。
就比如这里通过对比三个突破点的客观条件,我们能得出哪一个突破是最佳的,这里的对比完全参考的是盘面告诉我们的客观事实,不带有任何主观因素,之后我们也可以从盘面上看出来,当我们真正用冷静、客观的视角去分析盘面之后,市场会给到我们多大的奖励。
2 ETH
ETH和BTC展现出了高度相似的特点,这是很常见的现象。
首先也是一段流畅的下跌,而且底部产生了粉色的底部预警,我们能清晰画出一条趋势线1,之后由a点向上突破,但我们要注意到a点本身是没有实体的,是一条标准的十字星k线,这种形态的k线说明此处是多空双方激烈博弈的位置,我们在看到a之后的k线b,b虽然有了实体,但实体占整体的比例大概是50%,不能算很强势的多头动能,所以这里我们仍然只能判断为多空双方的博弈区,不能判断反转的确认。
然后我们会发现形成了一条趋势线2,并且由c点向上突破,注意c点的突破更小,而且实体占比更小,那就说明这里多空还是处于博弈阶段,不能判断反转结构,然后我们看到d点,马上形成了一根十字星小阴线,这印证了前面的推断,多空双方仍在僵持,未分胜负。然后我们看见e点,是一个实体占到了70%-80%的实体阳线,明显向上突破脱离了底部的横盘区间,因此e点才是这里空转多的结构确认位置。
我们再用前面讲的方法来对比一下这里的几个点:
a - 趋势线有验证,实体占比0%,略微突破趋势线
b - 趋势线有验证,实体占比50%,略微突破趋势线
c - 趋势线有验证,实体占比30%,略微突破趋势线
d - 趋势线有验证,实体占比5%,略微突破趋势线
e - 趋势线有验证,实体占比70%,明显突破趋势线
同样,这里的条件都是盘面展现出来的客观数据,没有带入任何个人主观意见,其中趋势线是否验证,实体占比完全是可用数据量化的结果,突破趋势线的幅度虽然不便于测量,但能用肉眼对比出明显和略微的程度,也属于一种客观的数据结果。
我们也能看见,一旦判断了最佳的入场位置,市场能带给我们多大的奖励。
另外,在e点之后有一段回调段,盘面上标记f的区域,注意到这里虽然有回调,但我们仔细观察会发现,其中的阴线都逐步在减小,说明了这里的空方动能已经处于衰竭状态(注意,多空力量的衰竭是威科夫理论中的重要分析)。
3 黄金
今天的黄金就是很典型的“有行情,无机会”。
首先我们能看见一大段的底部预警,粉色粗线标出的位置,形成一条趋势线1,由a点突破,但我们注意到趋势线1是没经过市场确认的,而且加上之前的暴跌,这里判断反转的风险是非常大的!我们尽量不要在这种突然放大的波动之后去判断行情,很容易再次发生反转。
之后形成了趋势线2,而且由b点向上突破,虽然2是一条经过验证的趋势线,但b点也是一个十字星形态,没有展现出太强的多方动能,不仅如此,b点之后连续几条k线都是小实体的十字星形态,这里也最好是放弃。
最后有一段顶部预警,而且形成了趋势线3,但我们要注意到的是c这条线,明显突然增大的下影线,和1之前的波动很像,属于突发的震荡行情,只是幅度没有1那么大,同时我们看到3被突破的位置,同样是一根实体突然增大的夸张阴线,这种波动放大的区域,我们尽量放弃。
总结
我们自己的想法是主观的,市场是客观的。
趋势线是否被验证,是客观事实。
实体占比是多少,是客观数据。
突破幅度是否明显,是客观表现。
当我们用这些客观条件去做筛选,情绪自然会退出决策。
交易不是预测,而是筛选。不是抓住所有机会,而是只做质量最高的那一个。
市场每天都有行情,也存在很多机会和陷阱,我们的本金就好像子弹一样,如果每一个机会和陷阱都去判断入场,会浪费弹药,所以我们要做一个狙击手,大多数时间都在潜伏和等待机会,很少出击,但出手必杀敌,当你学会今天讲的这种筛选逻辑之后,交易就会变得更安静。

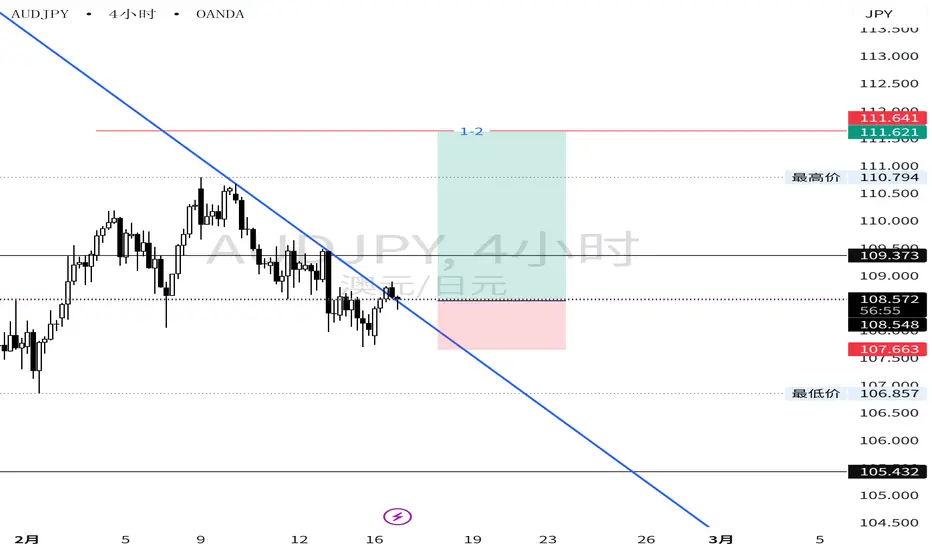
金汇得手:下周行情预测20260214 美元指数本周收阴,下周关注97.3-96.3区间,强支撑95.3强阻力98.6。日线周五收十字星,周一继续关注97.1-96.3区间。
重点看黄金,本周由于接近春节,流动性差,整体波动不大,周线收长影阳线。下周倾向继续震荡为主,还是和上周分析一样,大区间5600-4400,小区间5100(5140)-4650,未破位前高空低多。日线周五二次下探没新低反弹,凌晨破日内高点并且高位收盘,日线收阳。单看日线,周一倾向上涨,但是结合最近几天走势,阴阳交替出现,所以周一要防止行情冲高回落收阴。阻力昨天高点5046附近,不破倾向小止损空,强阻力5094附近,触及可以再空。除非行情站稳5100甚至5140,才能继续上看5250甚至5400。下方支撑顶底转换4990附近,也是日内多空分水,不破可以多。如果有效下破,估计还会去4960-50附近,触及可以再多。
操作建议:5040上方找机会空,5000下方或接近4960多。昨天给到4990附近空,4988空,4930附近多,5010空。
原油周线震荡收十字星,下周暂时还是继续按照震荡思路。关注66-60大区间,未破位前高空低多。日线周五收十字阴线,证明下方支撑还是很强的。周一接近昨天低点不破多,上方接近64不破做空。分析仅供参考,实盘为准。


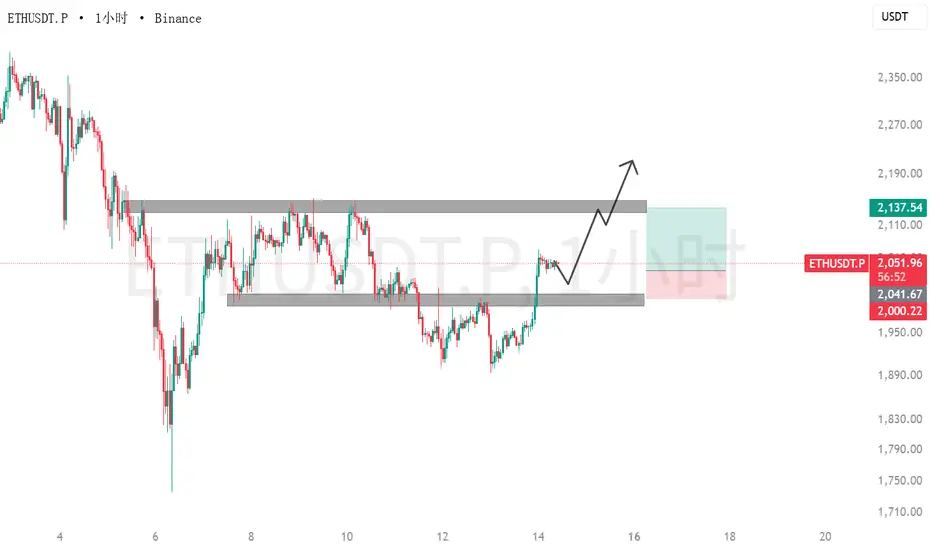
ETH 行情分析 1H以太坊短线走势比大饼强,2000整数关口上破,阻力变支撑。后市走势有两种预期,横盘强势调整,可以直接参与做多。弱势调整,大概率会再次回踩2000支撑附近,依旧可以参与做多,目标看前高2130-2150。日内重点关注调整力度强弱,找机会做多,不参与做空
BTC 行情分析 1H比特币小时级别压力68000已经上破,多头有继续上攻的迹象,后市回踩68000-67500企稳可以考虑参与做多,目标先看69500,上破看水平压力71000-71500,不参与做空

来伊份交易计划SSE:603777
本标的行情概览:
自2017年以来,该股长期运行于 7.80元 至 20.56元 的宽幅箱体(黄色区域)之内。历史上,大多数活跃行情集中在 10.99元 至 17.37元 区间(白线区域),显示该区域为多空博弈的核心地带。
当下行情判断:
核心区间: 股价目前运行在 10.99元 至 14.18元 这一关键红色密集交易区内。当前价格 13.06元 恰好处于这个箱体的中轴位置,属于典型的“上有压力,下有支撑”状态。
支撑位: 强支撑:10.99元 附近。这是近一两年来多次触底反弹的位置,如果跌破这里,下方空间将直接看向 7.80元 左右。
压力位:
近期阻力:14.18元。股价最近多次试图突破该位置均未能站稳。
中期阻力:17.37元 及 20.56元。这些是前高位置,积压了较多的套牢盘。
成交量: 近期成交量相对萎缩,市场观望情绪浓厚,缺乏强有力的资金推动股价向上突破。
基于目前走势,存在两种可能:
方案 A(大概率 - 持续震荡): 若无显著利好催化,股价大概率继续在 11.00 - 14.00 元之间整理。通过时间换取空间,消化上方抛压,等待基本面(如消费回暖、业绩改善)形成共振。
方案 B(小概率 - 破位下行): 如果宏观消费环境走弱或年报数据不及预期,股价可能回踩 11.00 元支撑位甚至跌破。
建仓:
分批布局: 理想的买点在 11元 附近(靠近支撑位)。
突破买入: 如果放量突破并站稳 14.20元 以上,说明上涨趋势确立,届时可以右侧跟随。
止损设置:
严格止损位设在 10.80元 下方。一旦收盘有效跌破,说明箱体支撑失效,需果断离场观望,防止价格滑向 8 元区间。
【免责声明】
本内容仅为基于公开资料和个人分析的数据记录与观点分享,不构成任何投资建议。股市有风险,投资需谨慎。据此操作,风险自负。

# 26-2-12 A Random Market Demands Fixed Rules1. BTC
First, we can see Trendline 1. At the top of this trendline, a blue alert line appeared. Later, the trendline was broken downward at point a, ending the uptrend here.
The key question is whether point a can be considered a multi-to-short structural reversal. There is no fixed answer. Objectively, it is indeed a breakout. Point a is a solid candle with almost no wick, and it does not land exactly on the trendline—it clearly exceeds it. However, we also notice a previous bullish candle that is more than twice the size of point a’s bearish candle, indicating that the downward momentum at a is not yet very strong.
Thus, there is no definitive answer. This structural reversal has both pros and cons, and it depends on your risk preference. Aggressive traders may consider this a confirmed multi-to-short reversal point, while conservative traders may choose to skip it. Remember: risk and reward are always proportional. You either choose steady conservatism or aggressive growth—you cannot have both.
Afterwards, the market entered a consolidation phase. When Trendline 2 was formed, a blue alert line appeared at the top. The trendline itself was fine, but the subsequent breakout raised concerns. The breakout candle had a wick more than twice the size of its body, a classic multi-vs-short battle candle. When seeing such a candle, caution is needed—this could be a trap! In region 3, multiple doji and long-wick candles appeared, showing that buyers and sellers were fighting intensely, with no clear winner. This is an area full of uncertainty, and it’s best to skip trading here.
Indeed, the market later reversed again, confirming the previous analysis. A new blue alert segment appeared in region 4.
In this area, there were only two upward candles, insufficient to form a trendline, so no breakout point could be defined. This leads to a common pitfall: many traders, during review, try to “reverse-engineer” their trades from the price action. For example, in region 4, a bearish candle engulfed the previous bullish candle, followed by a noticeable drop, retracement, and then another decline. Some might think: next time this happens, I should short without hesitation.
Reflect on your past reviews—have you ever changed your trading rules based on a single segment of price action? The problem is, if you do change your rules and then encounter a similar setup, the market may not follow the previous scenario.
This is why consistency and discipline are crucial in trading systems. Trading is about finding fixed patterns in a random market. Random price movements do not give us a probabilistic edge, but through fixed rules, probability can be tilted in our favor. These rules must be consistent and repeatable. For example, in region 4, the bearish engulfing candle may have led to a large move this time, tempting traders with profit. But can you be sure that every time this pattern occurs, it will produce such a profit? Have you backtested it? Are there historical data? What is the success rate and risk-reward ratio if this trade is repeated multiple times?
All these questions are full of uncertainty. In contrast, trendline breakouts follow Wyckoff’s classical theory, developed in the 20th century and validated by decades of market experience. Many traders have studied it—it has stood the test of time.
We should focus on trades that give us higher confidence.
The common pitfall is that a segment of price action may be caused by random factors and unrelated to any pattern. Such tempting setups can mislead traders into thinking they might repeat. This is the mistake of reverse-engineering from outcomes. We need verified trading systems and discipline, supported by multiple backtests, rather than relying on a single exceptional move.
2. ETH
In region 1, a blue alert appeared, but there were not enough candles to draw a trendline, so trendline analysis was not possible.
After a period of sideways consolidation, Trendline 2 was formed. Although it was not validated multiple times by the market, the trendline meets the definition and is considered valid. At point a, the trendline broke downward. Point a is a solid candle with no wick, and compared to BTC Trendline 1, the multi-vs-short momentum difference here is not as extreme. Therefore, a can be considered a confirmed multi-to-short reversal point.
Whether you capture the following bearish move depends on your trading style. Trailing stop strategies yield different results for different traders. Regardless, identifying the structural reversal here can provide potential exit opportunities.
3. Gold
The gold chart clearly shows little volatility for the day, with sideways consolidation throughout. During such periods, trading should be avoided. Sideways markets are prone to losses; any direction is possible, entirely random.
Finally, at Trendline 1, a top blue alert appeared, and the trendline broke downward. This breakout is similar to BTC’s Trendline 1—technically valid but not particularly strong. Judging its quality depends on the trader’s personality and risk preference, so no universal conclusion can be made.
As for subsequent sudden moves, whether this entry point could predict profits is subject to chance, as explained earlier. Using random outcomes to adjust a trading system is a common mistake.
Conclusion
In the market, we must learn to distinguish “confirmation points worth trading” from “random traps.” Focus on verified methods rather than being misled by isolated price moves. Only then can trading be confident and systematic, not reliant on luck.
确认点与随机陷阱 # 26-2-12|BTC · ETH · 黄金通过今天的行情,我们可以学到正确的复盘。
1 BTC
首先能看见一条趋势线1,之后在趋势线顶部看见了蓝线预警,之后趋势线在a点向下突破,终结了这里的上涨趋势。
关键是这个a点能不能算作多转空的结构转换,这个问题没有固定答案,我们从客观上来说,这里的确算是突破,而且a点是一根几乎没有影线的实体k线,也不是刚好落在趋势线上的情况,属于明显超出趋势线,但同时我们也注意到,前面有一根阳线,超过了a点阴线的两倍大,说明a点的下跌动能还没有看出非常强的空方动能。
所以说这个问题没有答案,这个结构转换有优点有缺点,关键取决于自己的风险偏好类型,如果是激进的交易者,当然可以判断一个多转空的确认点,如果是保守的交易者,也可以选择放弃这个机会,但是要记住:风险和收益永远成正比,你要么选择稳健保守,要么选择激进增长,这两个条件无法同时满足。
随后行情进入了一段震荡期,直到趋势线2形成之后,看见了一段顶部预警(蓝线标出位置),这里的趋势线没有问题,但问题在于后面的突破。我们能看见突破趋势线的位置,是一根影线长度超过实体两倍的k线,标准的多空博弈线,所以看见这根博弈线的时候,就应该开始警惕,这里可能是一个陷阱!随后我们发现,在3这个区域内部,形成了多个十字星、长影线的形态,说明多空双方在这个位置非常焦灼,无法分出胜负,这是一个充满未知和不确定性的位置!我们最好放弃这种机会。
果然,后面的行情再次发生了反转,这里的反转印证了上面的分析,说明这里的多头动能还没有完全衰竭。形成了一段蓝线预警段,在盘面上标出4的区域。
这个区域只有两根向上的阳线,没有足够的k线来构建趋势线,所以也无法找到一个趋势线突破的位置。这里就会有一个误区了:有很多人在复盘的时候,会对照行情走势去“反推”自己在交易中的操作,但这是一个错误的行为!就比如现在讨论的这个区域,有人会复盘看到,区域4当中,一根阴线强势反包了前一根阳线,后面带来一段很明显的下跌,然后回弹震荡,最后又继续下跌,带来很多的做空止盈范围,所以有人会判断:以后遇到这种情况,应该毫不犹豫做空。
想想自己之前的复盘过程中,有没有出现过这种根据某一段行情去改变自己交易系统规则的情况?但关键问题是,当你真的修改了这样的规则,你下次遇到了一样的行情,然后你果断参与,但下次的行情又不按这次的剧本走了。
这就是交易系统当中的一致性和纪律性,我们做交易是在一个随机的市场当中找到某些固定的规律,因为随机行情我们无法占据概率优势,但通过某种固定规律,也许能让概率偏向我们自己。这种规律,一定需要是固定的规则、以及能够重复。就比如上面遇到的情况,在区域4,发生了一个阴线反包阳线的情况,只不过之后有一段幅度比较大的下跌,你看见了,然后会眼红这里的空单利润,但你能确定每次遇到这种规律的时候,都能有这样的利润空间吗?回测过吗?有历史数据吗?这种操作多次重复下来的胜率是多少?盈亏比又是多少?
这些问题全都充满不确定性,而趋势线的突破,属于威科夫经典理论当中的分析,威科夫理论是20世纪提出,并经过了几十年的市场验证,无数交易员学习过这种方法,经得起时间的推敲和考验。
我们应该做更有把握的事。
但很多人的误区就在这,盘面上某一段行情可能是随机因素造成的,和某种形态并无关系,但这种行情过于诱人,会“误导”你,让你觉得可能下次还会发生这种情况,这就是根据结果去倒推原因的误区,我们需要的是经过验证的交易系统和纪律,需要多项回测数据来评判某个交易系统,而不是某一段特殊行情。
2 ETH
首先是区域1,产生了一段蓝线信号,但这里k线数量不足,无法画出趋势线,所以无法用趋势线理论来分析。
之后经过一段横盘震荡,形成了趋势线2,并未经过市场的多次验证,但这条趋势线也符合定义,是成立的。在a点向下突破,a点是一条实体k线,没有影线,而且我们对比BTC中的趋势线1会发现,这里没有那么悬殊的多空动能差距,所以这里的a点可以判断为一个多转空的确认点。
至于之后能不能吃到那一波空方利润,那就取决于自己的交易风格,移动止盈的策略,不同人的交易会产生不同的结果,但不管交易风格怎样,这里的结构转换点的判断确实能给我们带来不少的潜在止盈范围。
3 黄金
这个走势图我们一眼就能看出来,黄金这一天都没有太大的波动,一直是横盘整理的状态,这种时候我们应该避免交易,横盘是非常容易引起亏损的行情,任何方向都有可能,完全随机。
最后在趋势线1的位置,我们能看见顶部蓝线预警,而且趋势线向下突破,这个突破和BTC的趋势线1也很像,属于突破力度并不强的那种,严格抠定义,满足,但考虑到是否优质,需要打问号。因此这里如何判断,也取决于不同交易员的个人性格和风险偏好,无法给出统一的结论。
至于后面那一段突发的行情,是否能用这里的入场点来判断,前面已经详细解释了,这种根据随机事实去反推交易系统规则的方法是一个误区,能否吃到这一段利润,是需要一点点运气成分的。
总结
在市场中,我们要学会区分“值得参与的确认点”与“充满随机性的陷阱”,把注意力放在经过验证的方法上,而不是被偶发行情的结果所迷惑。只有这样,交易才能真正有把握,而非靠运气。