金汇得手:下周行情预测20251122 美元指数本周收阳,下周收月线,倾向继续看涨。接近99.5多,目标100.5,强阻力101.2-101.8附近。周五美元高位震荡,周一接近99.9或99.6多。
黄金本月可能会收十字星,下周继续区间震荡,并且周线也是十字星,所以并没有明显的方向。虽然大方向依旧多头,但是回调还没到位。单看周线,下周我们暂时建议4133-3998区间未破位前高空低多。上破继续看4150-4170甚至4200附近,下破看3970-3950附近,强支撑3930,极限位置3756附近。日线周五收十字星,周一继续震荡思路操作。拉开4小时,目前接近三角形末端整理,一旦有效破位,估计有接近250美金的空间。未破位前,接近下沿4030多,接近上沿4170空,近一点就接近4100空。短期或年底前个人倾向反弹空为主。
操作建议:周一早盘关注4064多空分水,先涨4080上方或接近4100空,先跌接近4040或30多,其他位置参考上面分析。昨天早盘4078空,首次4059附近多,4040多,4030和4022多,4063空,美盘4061多。
原油本周收阴,下周接近59.5空,目标57.4-56附近,强支撑前低55.3附近。日线昨天震荡下跌,收长下影阴线。周一接近昨天高点58.7不破小止损空,57.4附近不破小止损多。分析仅供参考,实盘为准。
图表形态

IBIT二段式下跌后 44上方为最后的倔强IBIT在经历了日线暴跌及月线暴跌后 已经可以看出即将形成三段式下跌 但是我个人认为第三段大概率不会成立
主要原因是因为周期不够
从长时间周期来看不足以跌破至36大关
所以我的理论 最低应在40附近
而从时效上 44应该基本上是极限位置
在40-44附近形成长期震荡 才能有可能去靠近36
但是从图形上我们明显看出该股的稳定性极差 波动性极高
从而得出 月线应该就是在跌至中至位附近后发生反弹
从而实现日线级别做底反弹
我估算的位置应该就是在44附近反弹至0.618的61附近
那如果跌穿36则可以止损 说明月线要有更大幅度的暴跌

美股调整估计差不多结束目前标普最高点算起高低差是下跌5.5%,50天均线标准是负2.71,Breadth Thrust是0.41,如果用EMA计算,已经在0.4以下。S5FI是31.41,今天收盘估计在30以下。已经接近10月时的目标。下周估计应该达标。
看过去10年50天均线标准差,标普一般程度的修正,50天均线标准差基本上落在-2%到-5.5%左右。再结合200均线标准差看,为了画面干净些没有显示出来,目前调整跟2024年4月时很相似。
我还是认为什么泡沫,流动性什么的就不要多想。影响股市因素天天有,日日新。基本上只要不是引发系统性危机的结构性因素,市场基本上是有结果后,再回头去找原因。其实到最后就是为高卖和低买找理由。就跟芯片里的二极管控制电压原理一样,1是高压0是低压,不用过度解读它的工作逻辑。
尾盘能会再一波强袭,然后周一有机会看到盘中翻转,要是真出现,这轮调整基本结束。标普最低6450点,高低差7%。下一波调整可能要到来年。当然可能今日就调整完成,但我觉得50天标准差需要跌多一点点,所以下周头两个交易日完成调整可能性比较大。
基本上就这样,唯独比特币情绪不太稳定,可能带来变数,但以过去图形历史看,目前这波调整已经接近完成的概率比较高。如要给出个数字,概率在7成以上。当然只是凭借验给出的直觉数字,而非科学计算得出的结论。当然没有绝对,被打脸时,脸别太肿就好。


黄金H1 – 这是一个区间还是即将突破?🟡 XAUUSD – 日内聪明资金计划 | 作者:Ryan_TitanTrader (21/11)
📈 市场背景
黄金继续在一个压缩的日内区间内交易,市场对美联储是否会很快降息的最新讨论做出反应。
根据新的报告,政策制定者保持谨慎,随着通胀进展放缓,早期降息预期正在消退。
这种转变推动美元走强,提高国债收益率,并暂时削弱黄金的看涨势头。
新闻的关键要点:
• 美联储官员指出,通胀“仍未达到需要的水平”,降低了早期降息的可能性。
• 市场已缩减对第一季度降息的预期,支持美元。
• 更高的收益率 → 更紧的金融条件 → 黄金难以突破溢价水平。
• 机构可能在承诺新的方向性移动之前,在两侧进行流动性抓取。
价格目前位于4030–4045区域附近,正好在折扣流动性之上,等待一个催化剂突破短期压缩。
🔎 技术分析 (1H / SMC结构)
• 市场结构:
黄金已完成一个明确的CHoCH + 短期看跌序列,现在压缩到4030附近的折扣区。
• 溢价卖出区 (4H供应):
4128–4130与未缓解的供应+买方流动性在内部高点之上对齐。
• 折扣买入区:
4030–4028位于上次清洁需求区内,之前发生过扫荡。
• 流动性地图:
→ 买方流动性:在4128–4135之上
→ 卖方流动性:在4028–4020之下
机构可能在提供方向之前扫荡一侧。
🔴 卖出设置 (溢价反应区)
• 入场:4128 – 4130
• 止损:4140
• 止盈:
→ 4080 (小失衡填补)
→ 4045 (区间EQ)
→ 4030–4028 (折扣需求重测)
📌 执行规则:等待流动性扫入区域+M5–M15上的看跌CHoCH后再入场。
🟢 买入设置 (折扣反应区)
• 入场:4030 – 4028
• 止损:4020
• 止盈:
→ 4060 (短期反应水平)
→ 4095 (效率填补)
→ 4120 (溢价重测)
📌 仅在价格扫过4030–4028口袋并显示出从折扣的看涨位移时有效。
⚠️ 风险管理注意事项
• 随着降息押注消退,美元强势可能意外飙升——在波动期间减少仓位。
• 除非形成清晰的结构突破,否则避免在4045–4085的震荡区内交易。
• 一旦流动性水平被占据,积极管理交易。
• 预计在低交易量的亚洲时段会有工程操控。
📝 总结
黄金在一个狭窄的日内区间内压缩,市场重新评估美联储降息的可能性。
SMC结构建议在决定性移动之前进行双向流动性扫荡:
• 卖出区:4128–4130 (溢价供应)
• 买入区:4030–4028 (折扣需求)
预计经典的积累 → 扫荡 → 位移模式,直到宏观条件创造新的趋势。
📍 关注@Ryan_TitanTrader获取更多聪明资金更新。

ETHUSDT 触及 H4 支撑:空单分批离场,警惕左侧抄底(11月21日)ETHUSDT (4小时级别)
时间: 2025年11月21日 22:12 (UTC+8)
💰 当前价格: 2736
📉 主要趋势: 4H级别空头趋势延续中
核心观点:
1、空单分批止盈(Take Profit): 系统监测到 H4 级别出现底部支撑信号(向上箭头/支撑确认),表明短期下跌动能可能减弱。建议在此位置逐步分批平掉部分空单,锁定既有利润,避免利润回撤。
2、风险控制(Stop Loss): 下移移动止损至 3000 一线。此举旨在保护高位空单的核心利润,同时给行情留出一定的波动空间。
3、操作警示(No Longs Yet): 当前仅为获利了结,并非反转信号。
整体趋势依然向下,均线系统呈空头排列。
此时“抢反弹”属于逆势交易,风险极高,建议继续保持空头思维,多看少动,耐心等待右侧信号。
——————————

(有梦分析)当前行情震荡下跌,多空关键位之下回调看空,可背靠下跌通道高抛低吸为主,突破看多或下破看空为辅。当前行情震荡下跌,多空关键位之下回调看空,可背靠下跌通道高抛低吸为主,突破看多或下破看空为辅。

(有梦分析)当前行情震荡下跌,多空关键位之下回调看空,可背靠下跌通道高抛低吸为主,突破看多或下破看空为辅。当前行情震荡下跌,多空关键位之下回调看空,可背靠下跌通道高抛低吸为主,突破看多或下破看空为辅。

(有梦分析)当前行情震荡上涨,多空关键位之上回调看多,二次不破前高回调看空,或背靠上涨通道高抛低吸为主,突破看多或下破看空为辅。当前行情震荡上涨,多空关键位之上回调看多,二次不破前高回调看空,或背靠上涨通道高抛低吸为主,突破看多或下破看空为辅。

BTC供应巨额放量,行情加速下跌今日盘面:东八区昨晚巨额放量,持续24小时的加速下跌,需求基本消失。
消息面:目前没有什么利多利空的有效事件发生,劳工部数据喜忧参半。
分析:目前多头连小时级别的反弹都没有形成,前期筑底迹象通道已跌破,大的下跌通道已修正,目前看跌至77K。由于盘前美股、加密全线下跌,机构ETF创最大净流出,IBIT领衔巨量抛盘(贝贝莱德的持仓成本在81K左右),导致上轮上涨通道和交易密集区阻力全部失效,持续加速下跌。
建议:保持冷静,空单待下跌至77K再做减持调整;已按计划在85K以下开多头头寸,目前浮亏,看72K完成多头建仓;同步开启现货买入。
共同学习,计划交易,知行合一。

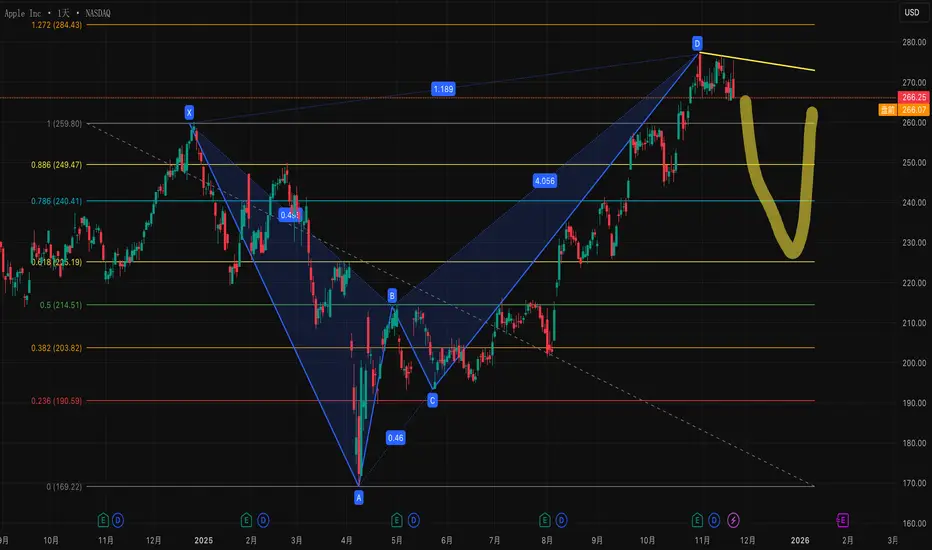
比特币跌破10万美元,市场极度恐慌,正是我们贪婪的时刻最近全球市场都陷入了调整危机,先是burry质疑了英伟达的泡沫,然后做空英伟达和palantir,虽然有很大分歧,但还是不少人选择落袋为安;另外美联储降息的分歧加大,造成美股调整,而比特币作为最投机的金融产品,表现就更疲软了。
恐慌指数(FGI)最近跌到了11,这是非常罕见的极度恐慌。上一次是今年4月,川普的解放日大跌。我们认为市场极度恐慌的时候,往往都是短期做多机会出现,所以现在是应该贪婪的时候了。
另外我们看技术走势,首先看左侧图,是比特币周线走势,这里虽然是大型的上升楔形破位,但也是abc调整a浪的中后期,后面的大b浪反弹,是值得参与的,关键就是买入的时机。
而右侧的日线图,我们看到的是一个下降楔形的系统提示,另外有一个超级的圆弧顶(这是我画的,并不是系统提供)。两个图表,我认为下降楔形更值得信任,因为我不认为比特币会走单边下跌,所以市场下跌周期中也会有反弹。至于圆弧顶,级别太大了,效果反而不一定非常好。
具体操作,就是再4小时以上级别,寻找买点,如果这里出现V型反转,那就看日线是否突破ma6;反之,我认为比较好的多头信号,应该是4小时级别的底背离。
至于仓位,既然是反弹,建议重仓,另外现货可以分批买入。

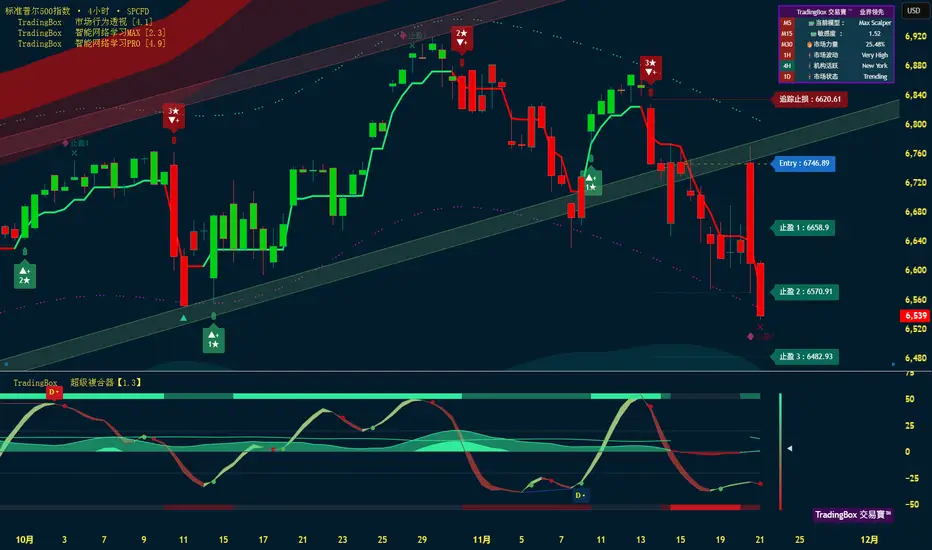
S&P 500趋势与基本交易策略周线复合:在周低点完成前还有2-3周的横盘或下跌⾏情。(熊)
日线复合:中性,但在复合器再次底部汇合前,日低点不太可能马上出现。
关键因素:ES 按预期创出新低。周线动能周期仍为看跌且未进入超卖区,这通常意味着在形成周线低点之前,还需要再经历一到两周的横盘或下行。
交易策略建议:若收盘价高于 6747.5(11/6 的次级摆动低点收盘价),则表明从 10 月高点以来的下跌应视为一次修正,而下一次周线动能的看涨反转大概率会完成这次修正。
若收盘价站上 6747.5 并不会否定再创新低的可能,只是意味着该走势属于复杂
修正(非简单 ABC 修正),而不是冲击型趋势。
若收盘价高于 6875.75(11/12 的摆动高点收盘价),则表示修正应已完成,接
下来有望出现新高。
⚠ 短期交易者应以TradingBox信号系统为准!

金汇得手:黄金非农数据震荡洗盘 今日继续主空辅多操作 美元指数昨天收长影阳线,今天周五收周线,关注100.3-99.93区间,强阻力100.6附近,强支撑99.6附近,估计跑不出这个大区间。黄金昨晚非农数据,如预期走出震荡洗盘行情,日线再次收十字星。由于周线偏震荡,所以今天暂时继续按照震荡思路操作。阻力4093附近,不破可以做空,如果走震荡接近昨天高点触及可以再空。万一行情上破,继续看4133-4145-4150附近,触及还是可以空。下方支撑日内低点4073附近, 也是日内多空分水,不破做多。一旦有效下破4073,估计还会去凌晨低点4043甚至33附近。强支撑依旧是4000整数关口,不破还是多,有效下破再看25-50美金。操作建议:早盘关注4073-4093区间,未破位前小止损高空低多,破位参考上面分析。昨天给出4110附近空,接近4041多,4057多,非农给出4096-4103附近空,4066附近多。原油昨天60附近受阻回落,日线收长上影阴线。早盘开盘就跌,今天还是高空为主,不过前面低点未破位前,不建议激进空。所以反弹59.4附近空,目标58.1附近,这个位置不破小止损博多,下破继续看57.5附近,触及还可以小损做多。分析仅供参考,实盘为准。


BTC空头结构延续,存在反弹博弈机会盘面:4小时级别,目前高低点仍在下降,空头延续。华尔街昨日早盘跌破前低,需求放量;东八区今日上午回调,突破小时级别下降趋势线,目前回踩支撑位需求放量。
消息面:东八区今日凌晨英伟达财报,完美答题,续写AI传奇;未来半小时后美劳工部发布非农,将进一步明确12月份降息预期,迷雾逐渐清晰。
分析:目前BTC仍然延续空头,但小时级别存在底翻可能,昨天英伟达财报符合华尔街预期,市场对于AI泡沫的焦虑降低,但对加密市场影响不大(昨天已给出判断),但跌破前低需求放量,回踩支撑需求放量,具备反弹可能,且概率较大,劳工部数据可能成为关键点。
建议:合约,长线空单再次减持(目前我的仓位已经减持3次,还有30%底仓博弈突破失败,空头继续延续);多单可以博弈按图设置好止盈止损。现货,继续等待(计划85K开始分批建仓)。
以上均为个人分析,不构成投资建议,共同学习,计划交易,知行合一。感谢关注。


(有梦分析)当前行情震荡下跌,多空关键位之下回调偏空,可背靠下跌通道高抛低吸为主,突破看多或下破看空为辅。当前行情震荡下跌,多空关键位之下回调偏空,可背靠下跌通道高抛低吸为主,突破看多或下破看空为辅。

(有梦分析)当前行情震荡下跌,多空关键位之下回调偏空,可背靠下跌通道高抛低吸为主,突破看多或下破看空为辅。当前行情震荡下跌,多空关键位之下回调偏空,可背靠下跌通道高抛低吸为主,突破看多或下破看空为辅。


(有梦分析)周四黄金计划,多空关键位之下回调偏空,当前行情震荡下跌,以回调看空为主,或背靠下跌通道高抛低吸,突破多下破空。周四黄金计划,多空关键位之下回调偏空,当前行情震荡下跌,以回调看空为主,或背靠下跌通道高抛低吸,突破多下破空。
