欧元EUR趋势与基本交易策略周线复合:周熊市趋势⾄少在持续2-3周以去完成周级别低点(熊)
日线复合:超波再次反转将确认日线⾼点,很可能就会在未来2-3天发⽣
关键因素:日线收盘价低于6.3日收盘价是⼀个波浪 B完成的信号,随后周熊市趋势将持续,以完成ABC的修正
交易策略建议:接下来⼏周,我的主要目标是确定欧元何时处于完成从 4 月份⾼点开始的修正
⚠ 短期交易者应以TradingBox信号系统为准
包含IO脚本

黄金GOLD趋势与基本交易策略周线复合:趋势将横盘或下跌 3-4 周左右,周低点才会完成(熊)
日线复合:黄⾦处在完成日线⾼点的位置
关键因素:黄⾦技术面是有些⽭盾的,在 5 月15 日某种程度是完成了ABC的修正
交易策略建议:如果黄⾦收盘价没有低于 5.30 日收盘价,且复合器形成⼀个底部看涨,这将是⼀个做多策略的设置
⚠ 短期交易者应以TradingBox信号系统为准

比特币趋势与交易策略周线复合:周⾼点即使没有完成也非常接近 (熊)
日线复合:日线低点应该已经完成,趋势横盘上涨3-4天 (牛)
关键因素:5 月 22 日⾄ 6 月 5 日的下跌是强动能的,在时间和价格上都比自 4 月低点修正要⼤, 警告周⾼点可能已经完成。我们会在日报上进⾏详细阐述
交易策略建议:周级别⾼点可能已经完成或非常接近。长期交易者的多头仓位应设置追逐⽌损
⚠ 短期交易者应以TradingBox信号系统为准

比特币剑指15万美金:技术面VSH与供需双轮驱动的超级周期
一、技术面:VSH奠定底层安全基石
比特币的底层技术依赖密码学哈希函数(如SHA-256),而VSH(Very Smooth Hash)作为高效抗碰撞算法 ,其安全性基于 模平方根难题(VSSR) ,为区块链提供不可篡改的信任基础。尽管VSH因伪随机性局限不直接用于比特币签名 ,但其设计思想(如高效乘法运算)反映了密码学创新的持续演进 ,强化了比特币网络抵御攻击的能力——这是长期价值存储的核心前提。
二、供需结构:史无前例的稀缺性危机
1. 供应枯竭加速
总量锁死:2100万枚BTC中95%已挖出,年通胀率仅1.7%^31,低于黄金和美元目标通胀率。
流动性枯竭:交易所可用BTC库存从2020年530万枚骤降至460万枚^35,仅够支撑6个月需求^55。
矿工惜售:减半后挖矿收益下降,矿工囤币意愿达历史高点^48。
2. 需求爆发式增长
机构鲸吞:2025年至今机构增持41.7万枚BTC(散户净卖出15.8万枚) ,美国现货ETF持仓超387亿美元^105。
全球渗透缺口:95%人口尚未持有BTC ,潜在增量需求庞大。
链上指标:活跃地址数周增15% ,累积地址月增49.5万枚^39,显示长期持有者主导市场。
三、历史周期与技术指标:15万美金的目标合理性
减半规律:历次减半后12-18个月涨幅超300%^73,当前处于2024减半后的爆发窗口。
技术形态:2025年价格走势与历史牛市高度吻合,关键支撑位65,000美金成新底部^63。
机构共识:渣打银行、Bernstein等预测2025年底目标价15万美金^164,核心逻辑是ETF资金持续流入(预计2025年达600亿美元^159)。
四、市场情绪与催化剂
情绪反转:恐惧贪婪指数从29%(恐惧)升至61%(贪婪)^120,释放买入信号。
宏观助力:全球降息周期开启,BTC作为抗通胀资产吸引力倍增^170。
结论:超级周期的完美风暴
技术面VSH代表的密码学进步保障了比特币的安全可信,而供需失衡(稀缺性+机构入场)则点燃了价格引擎。当链上流动性危机(仅460万枚可交易BTC)遇上ETF的百亿级需求^35,15万美金并非终点——渣打银行甚至看涨至25万美金^164。此刻的每次回调,都是历史级机会的入场券。

综合术数推演与市场分析:2025年6月9日-20日A股热点前瞻
一、术数框架与市场周期定位
根据《皇极经世》值年卦象,2025年(乙巳年)对应「雷火丰」卦,卦象为「离下震上」,象征光明与行动力的共振,主创新突破与技术迭代。结合纳甲筮法,6月9日(甲戌日)至20日(乙酉日)的旬卦为「水火既济」,此卦象提示市场将呈现阶段性平衡,但需警惕「初吉终乱」的波动风险。具体到板块,离火主科技、能源与文化产业,坎水主流动性及政策驱动领域,需重点关注以下方向:
二、热点题材与股票前瞻
1. AI算力与鸿蒙生态(离火之象)
驱动逻辑:卦象「离为火」对应技术创新与生态扩张,6月华为开发者大会(HDC·2025)将发布HarmonyOS新版本,叠加全球AI技术会议催化
细分方向:
算力基建:国产算力芯片(寒武纪、海光信息)、光模块(中际旭创、新易盛);
鸿蒙生态:软通动力(鸿蒙核心服务商)、润和软件(开源鸿蒙代码贡献第一);
AI应用场景:科大讯飞(教育+医疗AI)、金山办公(AI办公软件)。
风险提示:短期估值偏高(RSI超买),关注6月17日美联储议息会议对科技股流动性的扰动
2. 低空经济与商业航天(震雷之动)
驱动逻辑:卦象「震为雷」主政策突破与产业奇点,政策首次将商业航天列为未来产业,蓝箭航天技术突破降低成本30%
核心标的:
整机制造:中航沈飞(低空飞行器)、航天宏图(卫星应用);
基础设施:四川九州(北斗导航)、中国卫通(卫星通信);
材料与设备:铂力特(航天3D打印)、光启技术(超材料天线)。
催化事件:6月12日SpaceX星舰试射或带动板块情绪
3. 生物制造与创新药(巽风之渐)
驱动逻辑:卦象「巽为风」主政策扶持与产业渗透,发改委加速AI+生物制造融合,ASCO年会发布临床数据提振创新药
重点领域:
合成生物学:凯赛生物(生物基聚酰胺)、华恒生物(酶制剂);
创新药械:荣昌生物(ADC疗法)、万泰生物(九价HPV疫苗获批);
消费医疗:爱美客(医美器械)、华东医药(GLP-1类药物)。
资金动向:北向资金连续增持药明康德、泰格医药
4. 高股息与避险资产(艮山之稳)
驱动逻辑:卦象「艮为山」主防御与价值重估,美联储降息预期反复下,煤炭、电力等现金流稳定板块受捧
核心标的:
煤炭:中国神华(股息率7.2%)、陕西煤业(产能弹性);
电力:长江电力(水电龙头)、国投电力(绿电转型);
贵金属:山东黄金(金价突破2400美元)、银泰黄金(矿产储备丰富)。
风险提示:若6月经济数据超预期复苏,资金或切换至成长股
5. 消费复苏与618电商(兑泽之悦)
驱动逻辑:卦象「兑为泽」主情绪消费与社交传播,618促销数据超预期驱动「质价比」品类增长
细分机会:
智能家居:科沃斯(扫地机器人)、极米科技(投影仪);
国货美妆:珀莱雅(抖音渠道占比30%)、华熙生物(合成生物原料);
即时零售:顺丰同城(物流配送)、良品铺子(零食集合店)。
数据跟踪:关注6月18日全网GMV增速及细分品类榜单
三、风险警示与时空节点
6月12日(癸未日):美国CPI数据公布,若通胀超预期或打压降息预期,利空科技成长股
6月17日(戊子日):美联储议息会议,警惕「水火既济」卦象中「终乱」的流动性冲击
板块轮动策略:建议配置比例——科技成长(40%)+消费复苏(30%)+高股息(30%),短期关注「鸿蒙+低空经济」事件催化
象法解卦:
从「雷火丰」到「水火既济」,市场需经历「火炼真金」的结构性分化。离火主攻、坎水主守,建议以科技创新为矛,以高股息为盾,顺应政策与产业共振之势。

幸福蓝海300528:数字娱乐新零售领航者幸福蓝海(300528)的护城河分析:
一、行业地位与竞争优势
市场占有率:作为国内领先的院线电影放映商之一,幸福蓝海的票房收入和市场占有率在行业内处于领先地位。
品牌影响力:拥有较强的品牌知名度和美誉度,吸引了大量忠实顾客和合作伙伴。
资源整合能力:具有较强的影片引进、发行和营销能力,能够有效利用各种渠道推广电影作品。
技术优势:具备先进的技术设备和运营管理经验,提高了观影质量和效率。
多元化发展:除了传统影院业务外,还涉足文化娱乐、衍生品开发等领域,实现了业务的多元化布局。
二、核心竞争力
成本控制与管理效率:通过优化供应链管理和降低运营成本,提升了整体盈利水平。
创新能力:不断推出新的服务和产品,以满足消费者日益增长的需求。
客户关系维护:建立了完善的会员体系和服务网络,增强了客户的忠诚度和满意度。
政府政策支持:享受一定的税收优惠政策和产业扶持措施,为未来发展提供了有力保障。
三、潜在风险与挑战
市场竞争加剧:随着新玩家的进入和市场规模的扩大,竞争压力增大。
宏观经济环境变化:经济增长放缓可能导致居民消费意愿下降,影响票房收入。
版权保护不足:盗版问题严重影响了正版电影的收益。
数字化转型步伐加快:需要加大投入进行数字化转型和技术升级。
综上所述,幸福蓝海凭借其强大的市场地位、品牌影响力和多元化的业务模式,构建了较为坚固的护城河。然而,面对激烈的市场竞争和外部环境的波动,仍需持续提升自身实力以应对挑战。

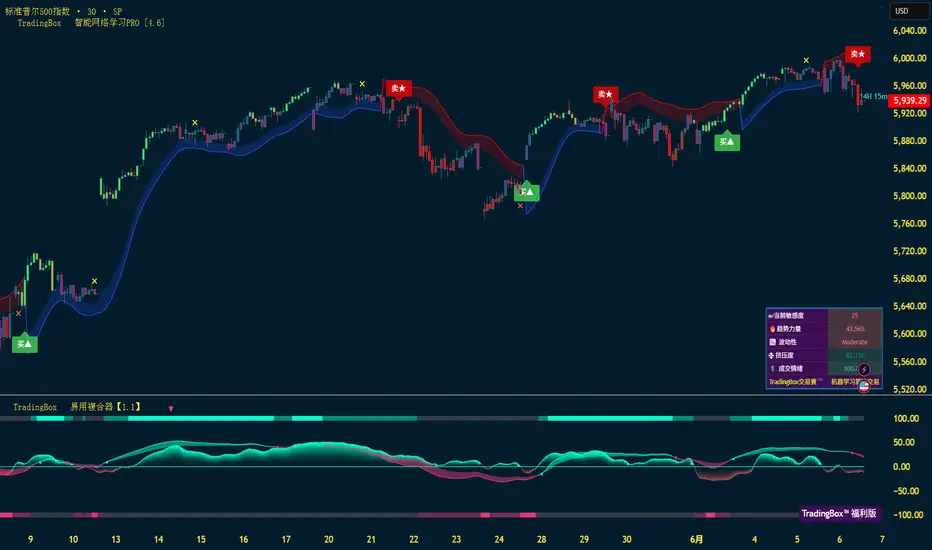
S&P 500趋势与基本交易策略周线复合:在完成周⾼点前,趋势整体⾄少为2-3周的⽜市
日线复合:日线整体应继续⽜市⾄少持续2-3天 (牛)
关键因素:⽜熊已经分明。若日收盘价⾼于 5 月 19 日收盘价表明小规模修正已完成,⽜市趋势应⾄少持续⼀周或两周。若低于 5802.8(SPX),表明 B 浪已完成,C 浪应到下周晚些时候完成
交易策略建议:未来⼏天的目标将是判断 ES 是否进⼊从 5 月 20 日⾼点完成修正的位置,随后应恢复周⽜市趋势
⚠ 短期交易者应以TradingBox信号系统为准
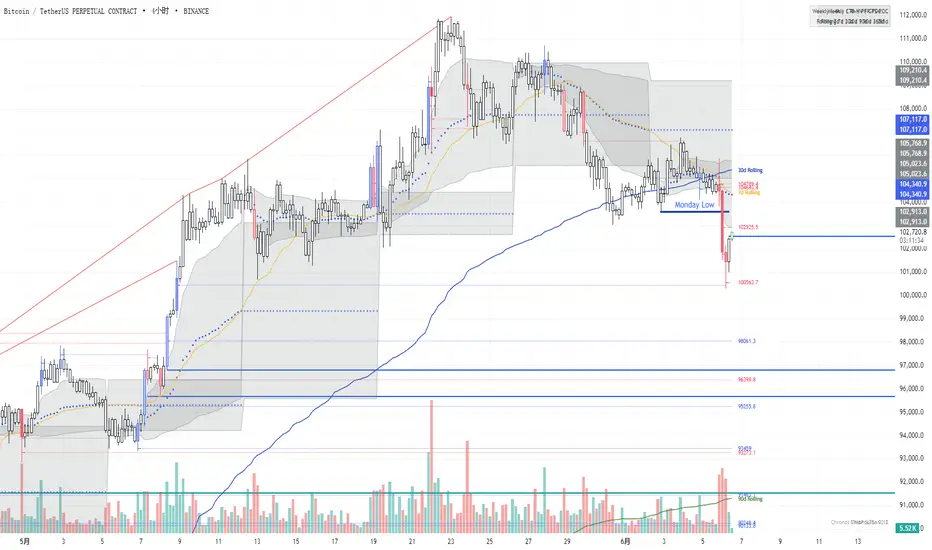
BTC 做多05/06/2025目前是看到了有力的短暂的放量k线测试dvah,仓位还是要等Monday low 拿掉再开比较合适
以及周一的错过轴疏点,也就是那条红线,确认反转,我们可以短暂看到上周的poc,
安静等待吧
BINANCE:BTCUSDT.P

黄金GOLD趋势与基本交易策略周线复合:周熊市趋势⾄少在持续2-3周以完成更⾼时间框架修正(熊)
日线复合:即使日⾼点尚未完成,上涨的空间也非常有限(熊)
关键因素:日线收盘价低于5.28收盘价是⼀个波浪 B完成的积极信号,随后周熊市趋势将持续,⾄ 5 月 12 日低点下⽅。若收盘价⾼于 1.14640,则周熊市趋势将被取消
交易策略建议:接下来⼏周,我的主要目标是确定欧元何时处于完成从 4 月份⾼点开始的修正
⚠ 短期交易者应以TradingBox信号系统为准

黄金GOLD趋势与基本交易策略周线复合:趋势将横盘或下跌 3-4 周左右,周低点才会完成 (熊)
日线复合:中性,但超波即将反转
关键因素:4 月⾼点以来的下跌应是⼀次修正,且熊市不应在 9 月之前完成。然⽽,若日收盘价超过GC前⾼点3422.8,将是小修正完成警告,我们会另⾏在讨论评估
交易策略建议:下⼀个目标是确定黄⾦何时完成W4修正 并恢复周级别⽜市趋势
⚠ 短期交易者应以TradingBox信号系统为准

btc看6h收盘是否能站在106000上方,站住了就死多它,要创新高。目前的大饼,关键的阻力位置在6-8小时级别,价格106000,如果你们的时间周期支持的话,注意看16小时级别 能不能放出一根阳线来,如果放出来就启动了16小时级别的行情,基本就是新高了。如果16小时不能放出阳线来往下走,就要留意10440这个位置不能有效破下去,否者就要去调整日线级别了。牛市的关键位置在96000左右,这个位置相当是2日线级别的支撑,如果破了这里,周线级别的反弹就走完了,也就暂时结束周线的牛市。


比特币趋势与交易策略周线复合:在周⾼点完成前⾏情可能横盘整理⾄上涨1-2周
日线复合:复合器临近底部汇合,日线低点临近
关键因素:任何下跌应为周趋势的修正,周趋势在未来 1-2周内应呈⽜市
交易策略建议:周趋势为⽜市,所有操作应以多头为主。直⾄复合器再次抵达上⽅
⚠ 短期交易者应以TradingBox信号系统为准


欧元EUR趋势与基本交易策略周线复合:周熊市趋势⾄少在持续2-3周以完成更⾼时间框架修正(熊)
日线复合: 价格抵达0.618回撤,日线⾼点即将完成(熊)
关键因素:欧元有望在下周初完成日⾼点。可能形成波浪 B,随后周熊市趋势将持续,⾄ 5 月 12 日低点下⽅。若收盘价⾼于 1.14640,则周熊市趋势将被取消
交易策略建议:接下来⼏周,我的主要目标是确定欧元何时处于完成从 4 月份⾼点开始的修正
⚠ 短期交易者应以TradingBox信号系统为准

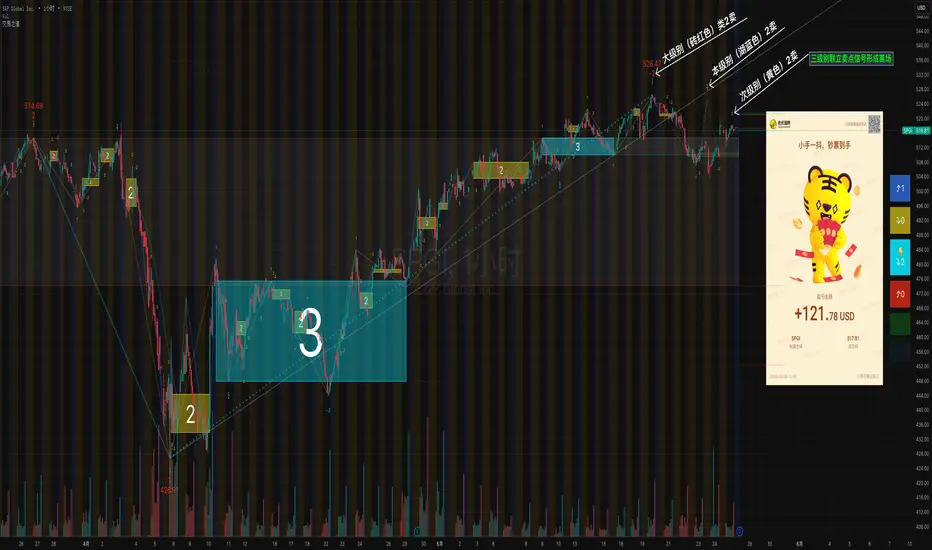
SPGI 缠论三级别联立构成,果断离场!2025/05/19/进
NYSE:SPGI 操作要点,三买一定要在第一个中枢后效果最好
本级别3买后,次级别2买位置进场
原文:第三类买点,一定要在第一个中枢后效果最好,如果在趋势的第N个中枢后,这样当然还是有利润,不过没必要了。
#缠论 #缠论脚本 #美股 #SPGI
离场:3级别联立构成,离场
大级别类二卖+本级别2卖+次级别2卖
黄金GOLD趋势与基本交易策略周线复合:趋势将横盘或下跌 3-4 周左右,周低点才会完成(熊)
日线复合:日线⾼点预期在下周初完成(熊)
关键因素:4月⾼点以来的下跌应是⼀次修正,且熊市不应在 9 月之前完成。然⽽,若日收盘价超过GC前⾼点3422.8,将是小修正完成警告,我们会另⾏在讨论评估。
交易策略建议:下⼀个目标是确定黄⾦何时完成W4修正 并恢复周级别⽜市趋势
⚠ 短期交易者应以TradingBox信号系统为准

工业自动化隐形冠军:塑机控制龙头+新能源第二曲线的技术护城河弘讯科技(603015)护城河分析
一、核心护城河要素
工业自动化控制技术壁垒
塑机控制系统龙头地位:公司是中国最大的注塑机控制系统供应商,市场份额超50%,核心产品(如伺服节能系统、智能控制系统)技术门槛高,客户粘性强。
自主研发能力:拥有200+项专利,伺服驱动、运动控制算法等核心技术自主可控,替代进口(如西门子、三菱)趋势明显。
下游行业深度绑定
注塑机行业集中度提升:受益于下游塑料加工行业智能化升级,头部客户(如海天国际、伊之密)依赖其控制系统,形成长期合作关系。
新能源领域拓展:在光伏、锂电池设备领域布局伺服驱动系统,2023年新能源业务收入占比提升至15%,成长性明确。
规模效应与成本优势
供应链垂直整合:关键零部件(如IGBT、编码器)国产化替代降低生产成本,毛利率维持在35%+(高于同业均值30%)。
服务网络覆盖广:全国30+服务网点,快速响应客户需求,售后壁垒高。
政策与行业标准壁垒
“智能制造”政策支持:符合国家工业自动化战略,享受税收优惠及补贴。
行业认证壁垒:产品需通过CE、UL等国际认证,新进入者需长时间积累。
二、潜在风险点
下游周期波动:注塑机行业与房地产、消费电子需求挂钩,若经济下行可能影响订单。
竞争加剧:汇川技术、埃斯顿等企业切入中低端市场,价格战风险需警惕。

中药创新+重症赛道龙头:政策壁垒与全产业链协同的护城河一、核心护城河要素
专利壁垒与独家品种优势
血必净注射液:作为国家保密配方(中药一级保护品种),享有20年行政保护期(至2028年),临床疗效明确且竞品极少,形成垄断性定价权。2023年该产品收入占比超30%,毛利率达85%以上。
配方颗粒全产业链布局:拥有600余种国标/省标配方颗粒生产资质,覆盖药材种植-加工-标准制定全流程,技术壁垒高(如指纹图谱质量控制),先发优势显著。
研发转化能力
研发投入强度:近三年研发费用率维持在6-8%(高于中药行业平均4%),聚焦脓毒症、心脑血管等重症领域,形成“血必净+盐酸法舒地尔(脑血管)+KB(抗肿瘤)”管线梯队。
院线渠道深度绑定:核心产品进入《国家医保目录》及《新型冠状病毒肺炎诊疗方案》,覆盖全国5000+家医院,医生处方习惯粘性强。
政策护城河
中药保护品种制度:血必净的保密配方属性规避仿制风险,政策红利持续。
配方颗粒试点企业资质:全国仅6家国家级试点企业,行业准入门槛极高。
成本控制与规模效应
药材基地垂直整合:在甘肃、云南等地自建GAP种植基地,对冲原材料价格波动,配方颗粒业务毛利率较同行高5-8个百分点。
二、潜在风险点
中药注射剂安全性争议:需持续投入循证医学研究以应对监管收紧。
集采压力:配方颗粒省级联盟集采(如山东)可能压缩利润空间,但独家品种受影响较小。
如何通过缠论走势提前测算回调合理价位和极限价位?
# 内部测量(内部测算)逻辑说明
## 📌 用途
用于在前一段走势结束或可能结束,且新走势第一段刚走出来,预估新走势第二段的**回调或反弹关键点位**。
---
## 📐 前提条件
- 一个完整走势至少包含三个次级别段落。
- 当**新走势第一段**形成后,即可进行内部测算。
---
## 🎯 关键点位(基于第一段的高低点计算)
### 1. 共振点位
- 含义:第二段回调或反弹的**合理支撑/阻力位置**。
- 判断依据:价格不跌破(或不升破)该位置,结构仍然合理。
### 2. 极限共振点位
- 含义:第二段回调或反弹的**极限容忍位置**。
- 判断依据:价格若突破该点,则说明当前新结构**大概率失效**,原趋势可能延续。
---
## 📊 脚本表现形式
- 当新走势第一段出现后,脚本在图表中绘制**两条水平线**:
- **共振点位线**
- **极限共振点位线**
---
## ✅ 总结
通过对第一段的内部测算,提前判断第二段的合理与极限反弹/回调区间,从而辅助判断新结构的成立与否。
