# 技术预判 | 上证4小时走势拆解# 技术预判 | 上证4小时走势拆解
同学们好呀~!今天结合上证4小时图,聊聊技术面的走势预判,先给大家打个预防针:**以下仅代表技术逻辑推导,不构成投资建议** ,股市有风险,决策要谨慎哟~
### 一、走势阶段复盘:从“驱动”到“震荡”的节奏
先看图表里的箭头结构:
- **绿色箭头(主升驱动浪)**:2025年6 - 8月,指数依托均线云带**单边向上突破**,均线发散、量能配合,是典型的“多头强势驱动阶段”,这波趋势把指数推到4000点心理关口附近;
- **黄色箭头(震荡上涨浪)**:8月 - 10月,指数进入**高位震荡爬升**,虽然整体向上,但K线反复回踩均线云带,说明“多头动能放缓,多空博弈加剧”,属于“趋势延续但节奏变缓”的阶段;
### 二、短期风险信号:4000点关口的“双压力”
现在指数卡在**4000点心理关口**,结合技术面,有两个关键风险值得关注:
#### 1. 心理关口的“抛压共振”
4000点对市场来说,是个“全民共识的心理位”—— 一部分资金会觉得“涨到整数关口,短期有回调需求”,选择**止盈锁定利润**;另一部分资金会观望“是否真突破”,**买盘意愿下降** 。
这种“止盈抛压 + 买盘观望”的共振,很容易让指数在4000点附近出现“短期调整信号”。
#### 2. 震荡起点的“支撑考验”
再看黄色箭头的**震荡上涨起点(2025年8月前后的平台)**,这个位置是前期“震荡蓄力、突破起涨”的关键区,也是当前**潜在的重要支撑位** 。
如果指数短期调整,极有可能回踩这个“震荡起点”找支撑 —— 一旦有效跌破,说明“震荡上涨的结构被破坏”,调整幅度可能扩大;若能守住,才有继续向上挑战4000点的底气。
### 三、两种演化路径:盯紧“支撑与压力”的博弈
基于当前技术形态,接下来指数可能走这两种路径,大家可以结合自己的交易策略灵活应对:
#### 路径1:“震荡蓄力后突破”(偏乐观)
- **信号**:指数回踩“震荡起点支撑位”(黄色箭头起涨区)时,**量能快速缩量企稳**,且均线云带(蓝色区域)保持向上发散;
- **应对**:若你是“趋势跟踪型”选手,可逢低加仓,博弈指数突破4000点关口,开启新驱动浪。
#### 路径2:“回调修正浪开启”(偏谨慎)
- **信号**:指数跌破“震荡起点支撑位”,且**均线云带开始向下收窄**(蓝色区域变宽转窄),说明“多头防守失效”;
- **应对**:若你是“风险规避型”选手,建议减仓观望,等指数回踩下方均线(比如绿色长期均线)、调整信号明确后,再考虑进场。
### 总结:技术预判是“概率游戏”,别忘风险底线!
最后再强调一遍:**以上只是技术面的逻辑推导,不构成投资建议** ~股市受政策、宏观经济、突发消息等超多因素影响,技术形态随时可能被打破。
大家做决策时,一定要结合自己的**风险承受能力**和**投资周期**,别盲目追涨杀跌~记住:技术预判是辅助工具,控制风险才是长期存活的关键!
有疑问随时在评论区唠~豆老师陪你们一起盯盘、一起学习技术分析的底层逻辑! (投资有风险,操作需谨慎哟~)
包含IO脚本

华夏幸福600340 产业新城服务商转型:PPP模式与产业集群的护城河一、华夏幸福的核心护城河:产业新城运营能力与PPP模式壁垒
从专业经济学角度看,企业的“护城河”是指其难以被竞争对手模仿或替代的可持续竞争优势,通常包括无形资产、转换成本、网络效应、成本优势及规模经济等要素。结合华夏幸福的业务模式与最新经营数据(2025年上半年及三季报),其护城河主要体现在以下两大核心维度:
1. 产业新城运营能力:产业集群打造与全流程服务的壁垒
华夏幸福的核心业务是产业新城开发与运营,其本质是为地方政府提供“产业发展+城市建设”的综合解决方案。经过二十余年(自2002年固安产业新城起步)的实践,公司已形成“产业优先、产城融合”的独特模式,核心竞争力在于:
产业集群打造能力:公司以“产业定位-招商落地-运营服务”为全流程,聚焦电子信息、高端装备、新能源汽车、航空航天等战略性新兴产业,通过龙头企业(如华为、京东方、航天科工)带动上下游企业集聚,形成产业集群。例如,固安产业新城已建立“电子信息、航空航天、生命健康”三大产业集群,吸引了1200余家入园企业,其中2024年从北京引进38家外迁企业,占全年新增的65%。这种“龙头引领+产业链配套”的模式,不仅提升了区域产业竞争力,也形成了“产业集群-企业集聚-产业升级”的正向循环,竞争对手难以在短时间内复制。
全流程服务能力:华夏幸福提供从规划设计、土地整理、基础设施建设、产业招商到城市运营的一体化服务,覆盖产业新城开发的全生命周期。这种“一站式”服务模式,要求企业具备跨领域整合能力(如与政府、建筑商、建材商、企业客户的协同),以及长期积累的行业经验(如420人招商团队的资源库、1.5万家目标企业的对接网络)。相比之下,新进入者往往只能聚焦某一环节(如单纯招商或基建),无法提供综合解决方案,因此难以与华夏幸福竞争。
2. PPP模式与区域深耕的规模经济优势
华夏幸福的产业新城业务采用“政府主导、企业运作、合作共赢”的PPP模式,这种模式的核心优势在于:
风险共担与收益稳定:PPP模式下,企业与政府签订长期合作协议(通常20-30年),政府负责政策制定与公共服务,企业负责资金投入与开发运营,收益来自土地整理服务费、基础设施建设费、产业发展服务费(按项目落地投资额的一定比例收取)及税收分成。这种模式不仅降低了企业的资金压力(政府分担部分风险),也保证了长期稳定的现金流(如固安产业新城的产业发展服务费已持续收取多年)。
区域深耕的规模效应:华夏幸福聚焦京津冀、长三角等核心区域,通过“以点带面”的方式复制成功模式(如嘉善产业新城作为长三角标杆,2017年上半年新增签约投资额58.9亿元,超过2016年全年)。区域深耕的优势在于:① 降低了“选址-招商-运营”的边际成本(如已建立的产业资源库、政府关系网络可复用);② 形成了“区域品牌效应”(如“华夏幸福产业新城”已成为优质产业的代名词,吸引更多地方政府与企业合作)。
3. 轻资产转型与债务重整的韧性
尽管华夏幸福曾因债务危机陷入困境(2021年超2100亿元债务违约),但轻资产转型(从“重资产开发”转向“产业服务+资产盘活”)与债务重整(截至2025年9月末,“以股抵债”456亿元,展期债务800亿元)使其重新获得了经营韧性:
轻资产模式降低风险:公司不再新增土地储备,聚焦存量项目的产业服务(如园区招商、运营)与资产盘活(如出售非核心区域资产23项,收入11.38亿元),减少了重资产开发的资金压力与市场风险。
债务重整改善财务状况:通过“以股抵债”“债务展期”等方式,公司资产负债率从2021年的94%降至2025年三季度的32%,短期偿债压力显著减轻。同时,保交楼任务完成70%(剩余1200套12月底交付),也修复了市场信任
总结
华夏幸福的护城河在于产业新城运营能力的不可复制性(产业集群打造与全流程服务)和PPP模式的规模经济优势(风险共担与长期收益)。尽管面临债务危机与亏损压力,但轻资产转型与债务重整使其重新获得了经营韧性。从经济学角度看,这种“产业+金融+政府合作”的模式,符合新型城镇化与产业升级的国家战略,具备长期可持续性。


教你抓走势方向
# 技术推演 | 123456 vs 123457 教你抓走势方向
同学们好呀~看到这张超直观的 “走势推演图”,瞬间get到大家想抓 **“方向选择密码”** 的心情~今天就用它拆解 “123456/7” 两种走法的技术逻辑,依旧强调:**纯技术交流,不构成投资建议** ,交易得结合自己的策略哟~
### 一、先懂“12345”结构:趋势的“必经之路”
不管最终走6还是7,前面的 **1→2→3→4→5** 是“趋势演变的必经节奏”,对应市场行为就是:
- **1(主升浪)**:绿色大阳线,代表 **多头强势驱动** ,资金疯狂进场推升指数(对应之前聊的“绿色主升浪”);
- **2→3(震荡加速)**:黄色弧形,代表 **多头动能放缓、高位博弈** (对应“黄色震荡上涨”),这里是“变盘前的蓄力区”;
- **4(回调浪)**:红色下跌,代表 **短期抛压释放** ,可能是“4000点心理关口的止盈盘”,也可能是“技术面的调整需求”;
- **5(关键博弈区)**:黄色横盘,代表 **多空重新平衡** ,是“决定最终方向(6或7)的核心区”!
### 二、“123456” vs “123457”:关键看“5区”的信号
两种走法的核心差异,全在 **“5区结束后,多空力量的胜负”** ,咱们盯这两个“技术信号”:
#### 走法1:123456(空头占优,深度回调)
- **信号特征**:
5区(黄色横盘)结束后,指数 **跌破“1→2的起涨支撑位”**(比如图里绿色1的上沿),且均线开始 **向下发散**(类似之前聊的“云带收窄转下”);
这说明“多头防守彻底失效,空头掌握主动权”。
- **应对策略**:
趋势跟踪型选手 **果断减仓/止损** ,别扛着!风险规避型选手可以“空仓观望”,等6的下跌浪走完、新支撑出现再说。
#### 走法2:123457(多头反攻,延续上涨)
- **信号特征**:
5区(黄色横盘)结束后,指数 **放量突破“3区的压力位”**(比如图里黄色3的上沿),且均线重新 **向上发散**(云带开口扩大);
这说明“空头抛压被消化,多头重拾动能”。
- **应对策略**:
趋势跟踪型选手 **逢低加仓** ,博弈7的新驱动浪;稳健型选手可以“持有观望”,等突破确认后再加仓。
### 三、“5区”怎么盯?3个实操细节要注意
既然5区是“方向选择核心”,咱们得盯着这3个细节,提前预判走6还是7:
#### 1. 量能变化:缩量vs放量
- 若5区 **持续缩量** ,说明“资金观望情绪浓”,后续容易走6(空头借缩量砸盘);
- 若5区 **逐步放量** ,说明“有资金悄悄吸筹”,后续走7(多头反攻)的概率高。
#### 2. 均线关系:缠绕vs发散
- 若5区里 **均线反复缠绕**(比如短期均线和长期均线交叉),说明“多空没共识”,走6的风险大;
- 若5区里 **均线开始向上发散**(短期均线上穿长期均线),说明“多头在蓄力”,走7的可能性高。
#### 3. 关键支撑:守得住vs守不住
- 若5区结束后,指数 **守住“1→2的起涨支撑”**(不跌破+快速反弹),走7的概率大;
- 若 **有效跌破支撑**(放量下破+反弹无力),走6的风险高。
### 总结:技术分析是“找概率、做应对”,别赌单一走法!
最后再敲黑板:**以上是技术逻辑推导,不构成投资建议** ~股市里“黑天鹅”随时飞,123456和7的走法都有概率,咱们要做的是“识别信号、提前应对”,而不是“赌涨跌”。
记住:交易的核心是 **“控制风险”** —— 不管走6还是7,只要提前做好“支撑/压力位的应对策略”,就能“涨有利润、跌有安全垫”!
想继续唠“不同周期的ABCD结构”“如何结合指标辅助判断”,评论区随时见~豆老师陪你们一起把技术分析玩明白! (投资有风险,决策要理性哟~)

黄金GOLD趋势与基本交易策略周线复合:在确认周低点前,⾏情⾄少横盘或下跌2-3周。(熊)
日线复合:日⾼点可能在未来2-3天内出现。(牛)
关键因素:今天是一个日线时间因子,应是完成日线高点及自10月底低点以来反弹修正的最大时间窗口。
交易策略建议:周线低点在未来 2–3周内 不太可能出现。
⚠ 短期交易者应以TradingBox信号系统为准!


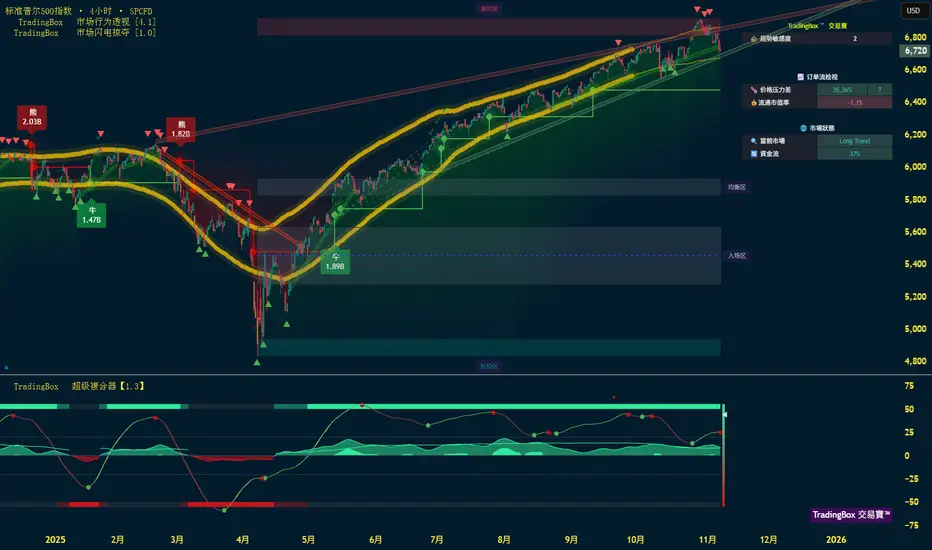
S&P 500趋势与基本交易策略周线复合:在周低点完成前还有2-3周的横盘或下跌⾏情。(熊)
日线复合:上周五的下跌,⼤幅跌出快云,潜在的日低点可能已经出现。
关键因素:若ESZ25收盘价跌破 6857.75(11月10日收盘价),则修正应视为完成,日线动能将形成看跌反转(Bear Reversal),随后应继续沿着周线级别的空头趋势下行,目标低于 11月7日低点。若收盘价突破 6925.75(10月28日收盘价),则应出现新的高点。
交易策略建议:如果从上周五低点开始的上涨只是如预期的修正走势,那么今天的价格和时间的反弹已经接近修正的极限区间,这意味着当前的反弹可能即将完成,对主要的下行趋势进行修正。
⚠ 短期交易者应以TradingBox信号系统为准!

000826 启迪环境 绿色转型阵痛期:环保巨头的债务博弈与技术救赎一、启迪环境(000826)的护城河分析
作为环保行业曾经的龙头企业,启迪环境的护城河呈现“技术储备+全产业链布局”的潜在优势,但实际竞争力因战略失误和财务危机被严重削弱,需从以下维度辩证评估:
技术壁垒的“虚实”矛盾
专利积累:公司拥有134项发明专利、195项实用新型专利及95项软件著作权,覆盖垃圾焚烧二噁英控制(0.01ng-TEQ/m³)、盐湖提锂技术(启迪清源)等前沿领域
产业化滞后:核心技术(如氢能、盐湖提锂)尚未形成规模化盈利,技术转化率低,导致研发投入未能转化为实际竞争力
标准制定权:参与制定固废处置国家标准,具备行业话语权,但政策红利未能有效绑定企业护城河
全产业链布局的“双刃剑”效应
业务协同性不足:覆盖环卫服务(55.83%)、水务处理(22.05%)、固废处置(17.35%)三大板块,但各业务线资源分散,缺乏聚焦,导致运营效率低下(2024Q3单季净利暴跌846%)
轻资产转型尝试:推动“能源环保一体化”战略,通过济南焚烧发电项目等实现多能输出,但债务压力下难以持续投入
政策依赖型护城河的脆弱性
REITs与碳交易概念:9个垃圾焚烧厂符合公募REITs准入(潜在估值60亿),年碳减排量500万吨(CCER激活后收益2.5亿),但政策落地存在不确定性
政策退坡风险:PPP模式退潮后,过度依赖政府项目的商业模式难以为继,2023年营收同比下滑0.66%-3.50%
二、启迪环境的发展前景评估
(一)短期困境:债务危机与退市风险主导
财务健康度崩塌:截至2024Q3,资产负债率133.58%,流动比率0.43,速动比率0.38,短期偿债能力“归零”;净资产-15.76亿,若2024年报未转正将触发退市
诉讼与流动性危机:累计诉讼51.65亿(占净资产83%),控股股东启迪科服持股仅0.04%,无实控人,融资能力丧失
(二)中长期机遇:政策与技术双轮驱动的“困境反转”可能性
政策红利释放:“无废城市”与长江大保护:子公司雄安浦华引入三峡资本,协同长江生态环保项目,或受益于区域政策倾斜
碳中和与氢能布局:定增氢能项目虽存股权稀释风险,但长期契合“双碳”趋势,技术储备或成未来筹码
技术转化与模式创新:
智慧环卫与无人设备:与华为合作的环卫机器人订单落地,L4级无人驾驶环卫车实现多场景应用,有望提升运营效率
危废资源化与盐湖提锂:若盐湖提锂技术实现产业化,或打开第二增长曲线(全球锂资源需求年增15%)
发展前景评级:★★☆☆☆(短期退市风险极高,中长期依赖政策与技术突破,概率低于30%)

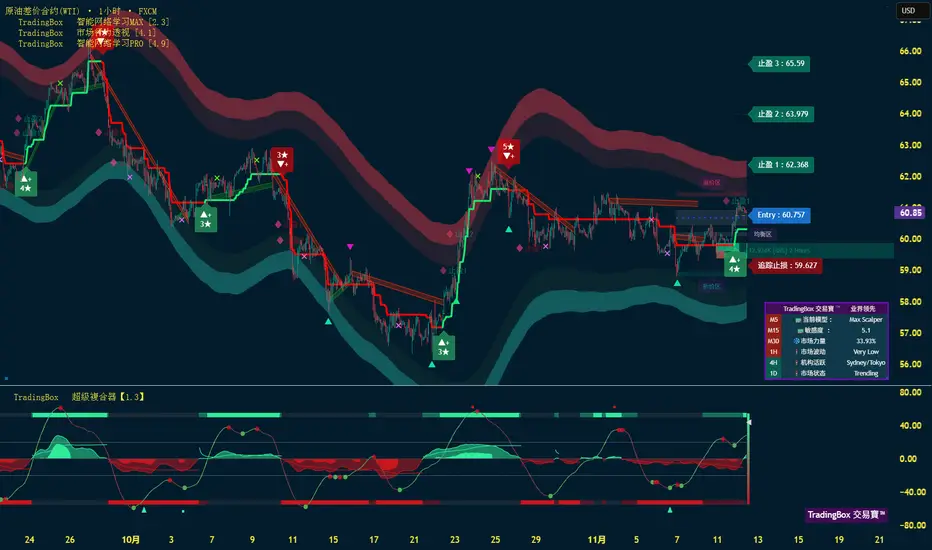
原油 CRUDE 趋势与基本交易策略周线复合:在周⾼点确认前,周整体⽜市应该持续2-3周。(牛)
日线复合:下⼀个日超波反转是日周双周期汇合看涨,适合做多。可能在下周初发⽣。(牛)
关键因素:日收盘价超过 61.05,11/3 的小型摆动⾼点,表明小型修正已完成。
交易策略建议:当前原油应处于⾄少周线级别多头趋势的初始阶段,可考虑逢低做多。并将⽌损设置在 10 月16 日收盘价以下。
⚠ 短期交易者应以TradingBox信号系统为准!
欧元EUR趋势与基本交易策略周线复合:周动能反转看涨,欧元处在完成周低点的位置。(牛)
日线复合:周和日动能均反转为看涨。(牛)
关键因素:欧元目前处于接近完成平⾏ABC形修正的位置。
交易策略建议:虽然需要等到 10 月 28 日的小型摆动⾼点收盘才能确认周线低点,但日和周的动能从关键价格区域反弹,欧元已经处于可以考虑做多交易的即时位置,⽌损设在上周低点下⽅。
⚠ 短期交易者应以TradingBox信号系统为准!

交易员Kyle黄金日内个人交易计划 2025.11.11交易员Kyle黄金日内个人交易计划
2025.11.11
仅为个人交易观点,不构成任何投资建议
一、昨日行情回顾
价格沿 1H 上升通道单边推进并再创 HH;欧盘拉升后,美盘前高位横盘。
成交分布在 4118–4126 与 4132–4136 两处形成明显 HVN;尾盘收于高位区间上沿附近。
多头动能占优,空头仅在新高处出现小幅获利了结回落。
二、技术结构
趋势:1H/30M 维持 HH-HL 抬升,15M 高位整固未破坏结构。
形态:高位旗形/箱体震荡,箱体上沿 4148–4150,下沿 4136–4132。
关键保护:4112–4108 为趋势保护带,失守则多头节奏显著转弱。
三、当前技术状态
1H:均线多头排列,价格贴上轨运行,回踩均被快速买起。
30M:沿趋势带震荡上行,回踩 10/20EMA 获承接。
15M:箱体内反复试压上沿,量价显示回落承接仍在。
结论:顺势看多为主,优先“突破—回踩—再上”的延续节奏。
关键价位
阻力:4148–4150(箱体上沿/前高)→ 4155–4158 → 4168 → 4180
支撑:4136–4132(箱体下沿)→ 4126–4120(HVN)→ 4112–4108(趋势/斜率带)→ 4098–4092(下方HVN)
四、今日交易策略
总思路:顺势多为主;逆势空仅在“确认性假突破或趋势破坏”时,轻仓快进快出。
1.突破回踩多(主策略)
触发:有效放量上破并站稳 4148–4150;回踩不破 4136,出现 1–2 根止跌/承接放量。
入场:4148 上方回踩确认多。
止损:4132 下方或最近 15M 结构低点(控制风险 8–12 美金)。
目标:TP1 4155,TP2 4168,TP3 4180;TP1 实现后止损抬至入场 -2。
2. 回撤承接多(次主策略)
触发:回落至 4136–4132 出现针探/吞没+量能放大。
入场:区间内分批做多。
止损:4126 或 4120 下方(择近)。
目标:TP1 4148,TP2 4158,强势续攻看 4168。
3. 深回撤低吸(防守反击)
触发:快速回测 4112–4108(趋势保护带)出现长下影或V型收复。
入场:轻仓试多,成交回补明显可加至半仓。
止损:4098 下方。
目标:TP1 4126,TP2 4136;尾仓看 4148。
4. 反手短空(仅当情境成立)
方案1:4155–4158 区域若放量假突破 + 15M 顶背离/反包成立,轻仓空;
方案2:4112 被有效跌破且 15M 收线下方,反抽 4112–4118 不站回,转为区间空。
止损:6–8 美金;
目标:先看 4136/4126;方案2 延伸看 4108/4098。一律快进快出。
六、总结
多头占优不变,优先执行 1/2 顺势多;
关注 4148–4150 的突破质量与 4136 / 4112 的承接力度;
4112–4108 为今日“风向标”,失守则收窄预期并转区间思路。
浮盈 ≥ 8 美金:止损抬到入场 -2;浮盈 ≥ 14 美金:尾仓改追踪上一根 15M 低点/趋势带。
计划外不交易;破位与形态不成立,耐心等待下一次机会。

比特币趋势与交易策略周线复合:周低点预期未来1-2周完成。(牛)
日线复合:日线超波反转,潜在的周低点可能在下周初完成。(牛)
关键因素:在形成和确认周线低点之前,⾏情仍可能出现新的低点。
交易策略建议:周低点形态理想时间是11.14日,将是做多设置机会。
⚠ 短期交易者应以TradingBox信号系统为准!

缠论解盘 2025.11.9 黄金30分钟走势结构黄金30分钟走势构筑盘整中枢中
主分类:中枢构筑完成后向下走出小b段,完成30分钟下跌走势。
支撑位3700左右。注意当小b段完成后,判断是否背驰。
防止分类:中枢盘整后以不创新低的方式完成下跌结构,
多单介入位置,中枢上方2,3买合并买点。

S&P 500趋势与基本交易策略周线复合:周线动能在超买区,需收盘跌破6791.7 才能确认周线⾼点。(熊)
日线复合:日线超波反转,表明 ES 可能已完成⼀个日线⾼点。(熊)
关键因素:标普500期货ES 尚未收盘跌破 6801以确认的周高点,在该信号出现之前,新的高点仍有可能。若 ES Z5 收盘价高于 6883,则表明新的高点可能到来,最低目标位为 6980。
交易策略建议:当日收盘价跌破 6801时,即为建立空头或做空仓位的⼊场信号。
⚠ 短期交易者应以TradingBox信号系统为准!
欧元EUR趋势与基本交易策略周线复合:周低点非常接近。(牛)
日线复合:价格预计将 横盘或下⾏ 2–3 天,以完成日线低点,这个日线低点应与周线低点同步出现。(熊)
关键因素:欧元目前处于接近完成 平⾏ABC 形修正 的位置,预计将在 未来⼀到两周内完成。
交易策略建议:关如果日收盘价突破 10 月 28 日的小波段⾼点,这将是周线低点已完成的信号。同时也是⼀个轻仓做多(多头)布局的机会,目标将突破9月⾼点。
⚠ 短期交易者应以TradingBox信号系统为准!


黄金GOLD趋势与基本交易策略周线复合:周线从超卖反转,暗示周⾼点已经完成,价会出现 横盘或下⾏ 3–4 周,直到形成周线低点。(熊)
日线复合:超波反转,日线低点已接近或已完成,但任何反弹都应被视为 周线熊市中的 3–4 天左右修正。(牛)
关键因素:黄⾦和白银目前都处于完成周线甚⾄月线⾼点的位置。
交易策略建议:若只要周线动能趋势仍为熊且未进⼊超卖(OS)区,保持做空为主。
⚠ 短期交易者应以TradingBox信号系统为准!

比特币 CME 出现 1% 缺口,技术分析比特币 CME 出现 1% 缺口,技术分析
今早,比特币 CME 期货图表上出现了约 1% 的价格缺口。
由于该缺口是在大幅下跌之后形成的,短期内需要关注**回补缺口(Gap Fill)以及**再次测试近期低点(Retest of Lows)的可能性。
Coinbase 溢价(Coinbase Premium)仍处于负值区间,但相比昨日略有回升,显示出美国现货市场的卖压有所减轻。
此外,未平仓合约(Open Interest)有所增加,数据显示**空头头寸**正在上升。
这表明在近期下跌过程中卖压不断累积,可能导致在缺口完全回补之前,市场出现 短期波动性加剧与盘整阶段。
总结:
CME 缺口范围:约 1%
市场结构:短期下跌后进入盘整阶段
Coinbase 溢价:仍为负值,但略有改善
未平仓合约:增加(空头头寸流入)
📍短期内,关键在于观察价格是否进入**缺口回补区间**并**再次测试近期低点**,同时维持在 98K 附近的支撑位,这一水平在短期内仍然至关重要。

“Gold Macro Trend 2018–2025 ”Hey everyone! Let’s fix the MA labels first—my bad earlier! It’s: white = 6-month MA, green = 1-year MA, yellow = 18-month MA, red = 2-year MA. Now let’s dive back into this gold daily chart, tying it to 2025’s global macro economy. Why’s this rally so enduring? Why do slopes swing from mellow to steep? Macro economics is the real hidden driver!
1. Trend Structure: A Step-by-Step Bull Market Fueled by Macro
Gold’s 2018-2025 move is a three-stage ride: macro logic kicks in → technicals confirm → money floods in. Every upswing locks into key macro beats:
1. Bottoming Phase (2018-Mid 2022): Strategic Buying Amid Macro Jitters
The world was all over the place back then: U.S. trade protectionism heated up, China-U.S. tensions rose, and after the Fed’s aggressive 2018 rate hikes, markets started betting on looser policy. Global cash scrambled for safe havens.On the chart: Prices bounced around lows, while the 6-month (white), 1-year (green), 18-month (yellow), and 2-year (red) MAs shifted from scattered to converging upward. That’s sovereign funds and central banks quietly piling in. WGC data shows central banks bought gold nonstop—they were hedging against shaky dollar credibility and rising geopolitical risks, laying the groundwork for the bull run.
2. Rally Kickoff (Mid 2022-2024): Macro Meets Technical Breakthrough
From 2022 onward, macro drivers went full throttle: the Russia-Ukraine war sparked safe-haven buys, the Fed’s brutal rate hikes (to fight inflation) shifted to rate-cut hints in 2023, and de-dollarization picked up steam (dollar’s share in global reserves kept falling).Technicals followed suit: Prices broke out of a long consolidation, rallying steadily along the 6-month (white) and 1-year (green) MAs with a gradually steeper slope. That’s institutional money pouring in. Macro-wise, gold had three winning cards—inflation hedge, safe haven, de-dollarization. Technically, MAs formed a bullish alignment, and every pullback to the 1-year (green) MA was a buying chance. The rally had serious staying power.
3. Accelerated Sprint (Late 2024-2025): Macro Hype + Emotional Frenzy
2025’s macro backdrop is gold’s dream: The Fed cut rates twice (down to 3.75%-4%) and stopped quantitative tightening, fueling global liquidity hopes. Meanwhile, Middle East and Russia-Ukraine conflicts dragged on, the IMF cut global growth to 2.7%, and safe-haven demand stayed red-hot. Most importantly, central bank gold buying surged—220 tons in Q3 2025, with 43% of central banks planning more purchases.On the chart: The slope spiked to nearly 70 degrees, prices soaring away from the 6-month (white) MA. That’s retail investors and short-term traders chasing the hype. Macro logic (rate cuts + safe havens + central bank buys) lit a fire, and technical breakthroughs amplified gains. But it’s also sowing seeds of a pullback—short-term overbought conditions and profit-taking pressure are building.
2. MA Code: Macro Money’s Cost Consensus
With the correct MA labels (white: 6-month, green: 1-year, yellow: 18-month, red: 2-year), each MA is a cost floor for different macro players, backed by solid logic:
1. 6-Month MA (White): Institutions’ Policy Radar
This is institutional investors’ (6-12 month holdings) policy compass. The Fed’s 2025 rate-cut pace and inflation data swing their gold positions.
When the Fed hints at cuts, institutions push prices up along this MA—steady slope means policy expectations match money flows.
If hot inflation sparks rate-hike fears, prices may test this MA, but as long as rate cuts are on track, institutions will step in to buy.
2. 1-Year MA (Green): Long-Term Money’s Safety Net
This is the macro floor for long-term investors (1-2 year holdings), rooted in de-dollarization and geopolitical risks.In 2025, central banks keep buying gold and reducing dollar reserves—this trend keeps the 1-year (green) MA rising, acting as the bull run’s anchor. Even above $4,000/oz, central banks don’t stop—they’re safeguarding financial security. As long as this MA holds, gold’s long-term bull case stays intact.
3. 18-Month (Yellow) & 2-Year (Red) MAs: Super-Long-Term Money’s Big Picture
These are strategic cost lines for sovereign funds and central banks, reflecting global economic restructuring.
The 2-year (red) MA’s upward trend mirrors the end of dollar dominance—OMFIF predicts the dollar’s reserve share will drop to 52% by 2035, boosting gold’s value as a non-sovereign asset.
The 18-month (yellow) MA’s support ties to geopolitical endurance—with conflicts ongoing and global nuclear warheads rising for the first time in 30 years, super-long money holds tight, making this MA a rock-solid support.
3. Slope Secrets: Macro Sentiment Thermometer
Slope changes show how intense macro sentiment is and how fast money is flowing—different slopes mean different macro scenarios:
1. Gentle Slope (2022-Early 2024, 40-50 Degrees): Macro Logic Unfolding Steadily
A steady, slow climb matched gradual macro progress: Fed near the end of hikes → rate-cut hopes, on-again-off-again geopolitics, and steady central bank buying.Institutions called the shots here, slowly rallying and pulling back to the 1-year (green) MA to shake out weak hands while waiting for macro confirmation. For traders, this was the sweet spot—clear macro logic + solid technical support. Pullbacks to the 1-year (green) MA were low-risk buys, backed by both macro and technicals.
2. Steep Slope (Late 2024-2025, Nearly 70 Degrees): Macro Hype Overdrive
A sharp slope means macro sentiment went wild: Fed rate cuts landed, central bank buying surprised to the upside, geopolitics worsened—markets shouted “gold only goes up,” drawing short-term traders and retail.But this slope is risky: Macro expectations are overstretched. The Fed has limited room for more cuts, and any de-escalation in conflicts could trigger a quick exit by speculators. Technically, prices are way too far from the 6-month (white) MA—mean reversion (pullback to longer MAs) is inevitable to cool down overheated expectations.
3. Consolidation Ahead: Macro Reckoning + Technical Repair
After a steep run, consolidation is all about balancing macro expectations. Markets wait for the Fed’s next move and geopolitical updates, while profit-takers lock in gains.
If macro logic holds (rate cuts + safe havens), prices will stabilize quickly after testing the 1-year (green) MA and rally again.
If macro shifts (e.g., inflation sparks rate-hike fears), we may see a deeper pullback to the 18-month (yellow) MA. But as long as the 2-year (red) MA climbs, de-dollarization and central bank buying will limit losses—adjustments are just opportunities.
4. Hidden Risks & Opportunities: Macro + Technical Confirmation
For real trading, you need both macro and technical signals to align—otherwise, it’s a low-probability bet:
1. Risk Signals: Macro Shift + Technical Breakdown
Macro: Fed unexpectedly turns hawkish (pauses cuts), China-U.S. trade tensions ease, geopolitics cool down—safe-haven demand dries up.
Technical: Prices close below the 1-year (green) MA for weeks, and the 6-month (white) MA turns down. That’s a double whammy—macro expectations reversed + money fleeing. Cut positions fast.
2. Opportunity Signals: Macro + Technical Alignment
Short-term: Stable macro (Fed stays on rate-cut path), prices pull back to the 6-month (white) MA with shrinking volume. Light positions for a quick bounce.
Medium-term: Macro gets stronger (better-than-expected central bank buying, geopolitics worsen), prices pull back to the 1-year (green) MA with bullish candlesticks. That’s institutional money buying—ideal for medium-term positions.
Long-term: Macro trends hold (de-dollarization + global uncertainty), prices test the 2-year (red) MA and stabilize. That’s a strategic buy for super-long funds—go big if you’re in it for the long haul.
5. Wrap-Up: Macro Sets Direction, Technicals Time Entries
Here’s the core: Macro economics decides gold’s long-term direction (rate cuts + de-dollarization + safe havens), while technicals (MAs, slopes, consolidation) dictate the timing. Trade with macro as your foundation and technicals as your guide:
Long-term investors: Watch the 2-year (red) MA + macro trends. As long as the Fed’s rate-cut cycle continues, central banks keep buying, and de-dollarization persists, hold on—short-term swings are just noise.
Medium-term traders: Focus on the 1-year (green) MA + policy events. After Fed meetings or WGC data releases, buy on pullbacks to the 1-year (green) MA if it holds, sell if it breaks. Follow the macro rhythm for swings.
Short-term traders: Stick to the 6-month (white) MA + sentiment. Buy when prices rally along it, dip-buy on pullbacks, and take quick profits. Don’t fight the macro trend—never short gold in a rate-cut cycle!
Simply put, this gold chart is a technical mirror of 2025’s global macro economy. MA support reflects macro money’s consensus, slope changes show sentiment swings, and consolidation marks macro expectation rebalancing. Nail the macro-technical alignment, and you’ll ride this bull run profitably—no more second-guessing!
(Note: This analysis is based on historical charts and macro data, not investment advice. Gold trading is risky—geopolitics, policy shifts, and liquidity can trigger big moves. Trade wisely!)

原油 CRUDE 趋势与基本交易策略周线复合:在周⾼点确认前,周整体⽜市应该持续2-3周。(牛)
日线复合:日⾼点接近或已完成,⾏情面临 3–4天左右的回调但该回调应属于周多头趋势中的短暂修正。(熊)
关键因素:上周⼼态位置表明,原油处在强烈完成ABCDE的位置。若收盘价突破61.79(10 月 23 日的小波段⾼点收盘价)确认周线看涨延续。
交易策略建议:当前原油应处于⾄少周线级别多头趋势的初始阶段,可考虑逢低做多。并将⽌损设置在 10 月16 日收盘价以下。
⚠ 短期交易者应以TradingBox信号系统为准!

比特币趋势与交易策略周线复合:周级别处在超卖区,未来2-3周可能出现周低点。(熊)
日线复合:在与周趋势同步前,日线反弹应该有限。
关键因素:日线出现⼀个 ABC 型修正,延伸⾄周⼀的⾼点,这意味着在形成确认周线低点之前⾏情仍可能出现新的低点。
交易策略建议:没有具体的趋势交易策略,待两到三周后确认周低点形态。理想时间是11.14日。
⚠ 短期交易者应以TradingBox信号系统为准!

缠论解盘 A股指数 日线下跌线段上证指数自2635以来的上涨,已经走出一个盘整走势。
且小b段内部趋势背驰。b段基本可以判定完结。
可以肯定的一点是,后面必然要走一个
日线下跌线段。
其后的分类:
1是走出日线线段级别的3类买点
2是直接回拉日线中枢A
需要注意的是,3类买点的位置,如果低于
3674,构成扩张性3类买点,则需要考虑
扩张或扩展的走势结构。

S&P 500趋势与基本交易策略周线复合:周线动能在超买区,需收盘跌破6664.01 才能确认周线⾼点。(熊)
日线复合:在日⾼点确认前,上升的空间应当有限。(熊)
关键因素:尚未收盘跌破 10 月 16 日的收盘价,因此尚未确认周⾼点,日线时间因素强烈暗示下周初是完成小五浪结构以及⾄少形成日⾼点、甚⾄周⾼点的理想时间窗⼝。
交易策略建议:市场可能在形成⼀个小级别的五浪推动,关注周三美联储会议,确认⾼的,SPX 周线收盘跌破6664,ES Z25 日线收盘跌破6773.25。
⚠ 短期交易者应以TradingBox信号系统为准!
