黄金周线在4682供给与4420需求之间轮动🟡 XAUUSD – 每周智能资金计划 | 作者: Ryan_TitanTrader (17/01)
📈 市场背景
黄金在高时间框架上结构性看涨,但周线价格走势明显转向受控的智能资金轮换。在提供买方流动性进入高价之后,继续上扬已停滞。
本周的主要驱动力 — 美元波动性、美国收益率的重定价,以及在持续高通胀数据与地缘政治对冲流动下的美联储降息预期 — 正在创造诱导和流动性工程的理想条件,而非干净的趋势扩展。
由于风险情绪脆弱且头寸拥挤,黄金在极端情况下表现出典型行为:反转、假突破和均值回归,而不是冲动性的继续上扬。
🔎 技术框架 – 智能资金结构 (H4–H1)
当前阶段:
高时间框架的看涨偏向仍然有效,但内部结构显示在提供流动性后从高价中分配。
关键思路:
从高价供应中卖出反应,或耐心等待更深的回调进入高时间框架需求以重新建仓多头。
结构性备注:
• 高时间框架的突破确认看涨主导
• 买方流动性已在近期高位被吸收
• 清晰的轮换通道已形成
• 流动性短缺区域充当磁铁
• 折扣需求与之前的订单簿 + 通道支撑对齐
💧 流动性区域与关键水平
• 🔴 卖出黄金 4680 – 4682 | 止损 4690
• 🟢 订单簿买入黄金 4420 – 4418 | 止损 4410
🧠 机构流动性预期
流动性扫荡 → 多重结构转换 / 上下转换 → 突破 → 位移 → 订单簿 / 杰出流动性回测 → 扩展或更深的轮换
🎯 执行规则
🔴 卖出黄金 4680 – 4682 | 止损 4690
规则:
✔ 价格触及高价通道供应
✔ 买方流动性已在近期高位被吸收
✔ H1–M15 的看跌多重结构转换 / 上下转换
✔ 下行突破确认分配
✔ 通过看跌杰出流动性或供应订单簿入场
目标:
• 4620 — 内部反应
• 4560 — 流动性短缺
• 4480 — 更深的周线轮换
• 积极止损(分配策略)
🟢 订单簿买入黄金 4420 – 4418 | 止损 4410
规则:
✔ 刷新的每周折扣区域
✔ 强烈的重叠:高时间框架的订单簿 + 通道支撑
✔ M15–H1 的看涨多重结构转换 / 上下转换
✔ 伴随位移的冲动性突破
✔ 通过精细的看涨订单簿入场
目标:
• 4560 — 首次反应
• 4620 — 中区流动性
• 4680+ — 如果扩展恢复则继续
⚠️ 风险备注
• 高价区域 = 流动性陷阱
• 在宏观新闻中预期假突破
• 没有多重结构转换 + 突破不进入
• 在高时间框架极端处降低风险
📍 摘要
黄金在结构上看涨,但本周的关注点在于精准执行,而非预测:
• 高价可能从 4680–4682 提供智能资金卖出,或
• 在 4420–4418 的折扣区域可能重新建仓多头以准备下一个冲动性走势。
让流动性先移动。
让结构第二次确认。
智能资金掌控 — 耐心是有回报的。⚡️
📌 关注 @Ryan_TitanTrader 获取每周智能资金黄金解读。
Goldlong

黄金在4672供给与4560需求间波动🟡 XAUUSD – 日内智能资金计划 | 作者:Ryan_TitanTrader (16/01)
📈 市场背景
黄金在更高的时间框架上保持结构性看涨,但日内价格走势已转向受控的轮换。由于今日的热驱动因素——美元波动性、美国收益率波动以及持续的美联储降息预期——智能资金不再推动延续性。相反,流动性正围绕溢价和折扣区间进行安排。
在美国宏观头条和与通胀相关的预期即将公布之际,黄金在极端情况下的表现符合预期:诱导、止损狩猎和均值回归,而非冲动的趋势延伸。
🔎 技术框架 – 智能资金结构 (H1–M15)
当前阶段:
高时间框架看涨偏向保持不变,而日内结构在买方流动性被提取后显示出修正性轮换。
关键观点:
寻找来自溢价供应的分配或更深回撤至折扣需求以重新建仓买入。
结构性笔记:
• 高时间框架BOS确认看涨主导
• 买方流动性已被提取
• 价格在旋转,而非冲动扩展
• 内部FVG作为下行磁铁
• 折扣需求与之前的OB支撑对齐
💧 流动性区域和触发器
• 🔴 卖出黄金 4670 – 4672 | SL 4680
• 🟢 买入黄金 4561 – 4559 | SL 4551
🧠 机构流动性预期
流动性扫荡 → MSS / CHoCH → BOS → 位移 → OB/FVG回测 → 扩展
🎯 执行规则
🔴 卖出黄金 4670 – 4672 | SL 4680
规则:
✔ 价格触及溢价供应
✔ 高点以上的买方流动性被提取
✔ M5–M15上的看跌MSS / CHoCH
✔ 明确的下行BOS
✔ 通过看跌FVG或供应OB进入
目标:
• 4620 — 内部反应
• 4585 — 流动性池
• 积极止损(分配操作)
🟢 买入黄金 4561 – 4559 | SL 4551
规则:
✔ 进入折扣需求
✔ 与OB + FVG重合
✔ M5–M15上的看涨MSS / CHoCH
✔ 强劲的上行BOS并伴有位移
✔ 通过精炼的看涨OB进入
目标:
• 4620 — 首次反应
• 4670 — 内部流动性
• 4700+ — 如果扩展恢复则继续
⚠️ 风险笔记
• 溢价区间 = 流动性陷阱
• 预计在新闻波动期间会有假突破
• 未经MSS + BOS不可进入
• 接近极限时减少仓位
📍 总结
黄金从结构上看是看涨的,但今天关注的是执行,而不是预测:
• 溢价可能在4670–4672处提供智能资金卖出,或
• 在4561–4559的折扣可能会为下一个更高的涨幅重新建仓。
让流动性先行动。
让结构确认第二。
智能资金掌控——耐心有回报。⚡️
📌 关注 @Ryan_TitanTrader 获取每日智能资金黄金解析。

黄金在4690供应与4576需求之间震荡🟡 XAUUSD – 日内聪明资金计划 | 作者 Ryan_TitanTrader (14/01)
📈 市场背景
黄金在创出新历史高点(ATH)后结构性看涨,但价格走势明显减缓,进入了轮换阶段。随着市场对今天的热驱动因素——美国通胀预期、美元波动性和国债收益率变化——的反应,聪明资金不再追逐上涨。相反,流动性正在围绕溢价和折扣区域进行调控。
在重要的美国数据和降息预期之前,黄金在极端表现上如预期般行动:止损猎捕、诱导和受控再平衡,而非干净的持续。
🔎 技术框架 – 聪明资金结构 (H1–M15)
当前阶段:
高时间框架的看涨偏见仍然存在,而日内结构在靠近历史高点时显示出修正轮换。
关键思路:
预计从历史高点附近的溢价供应分发,或向更深的折扣需求回调以重新建立多头。
结构说明:
• 高时间框架的突破确认看涨主导
• 历史高点区域提供了买方流动性
• 价格在旋转,而非冲动性扩张
• 内部缺口作为下行磁铁
• 折扣需求与高时间框架的EMA支撑一致
💧 流动性区域与触发器
• 🔴 卖出黄金 4688 – 4690 | SL 4700
• 🟢 买入黄金 4578 – 4576 | SL 4568
🧠 机构流动性预期
流动性扫荡 → MSS / CHoCH → BOS → 位移 → OB/FVG重新测试 → 扩张
🎯 执行规则
🔴 卖出黄金 4688 – 4690 | SL 4700
规则:
✔ 价格触及溢价历史高点供应
✔ 高位以上的买方流动性被吸取
✔ 在M5–M15上出现看跌的MSS / CHoCH
✔ 明确的下行BOS
✔ 通过看跌的FVG或供应OB进入
目标:
• 4635 — 内部反应
• 4600 — 流动性池
• 积极止损(分发操作)
🟢 买入黄金 4578 – 4576 | SL 4568
规则:
✔ 触及折扣需求
✔ 与OB + FVG一致
✔ 在M5–M15上出现看涨的MSS / CHoCH
✔ 强烈的上行BOS伴随位移
✔ 通过修正后的看涨OB进入
目标:
• 4620 — 首次反应
• 4680 — 内部流动性
• 4720+ — 如果扩张恢复则为历史高点延伸
⚠️ 风险说明
• 历史高点区域是流动性陷阱
• 预期在新闻波动期间出现假突破
• 没有MSS + BOS不可以进入
• 在历史高点附近减少仓位 — 区域扩张风险
📍 总结
黄金按结构看涨,但今天是执行,而非预测:
• 溢价可能在4688–4690提供聪明资金卖出,或
• 在4578–4576的折扣区可能重新建立多头以推向下一个历史高点。
让流动性先行动。
让结构确认其二。
聪明资金控制 — 耐心是关键。 ⚡️
📌 关注 @Ryan_TitanTrader 获取每日聪明资金黄金解读。

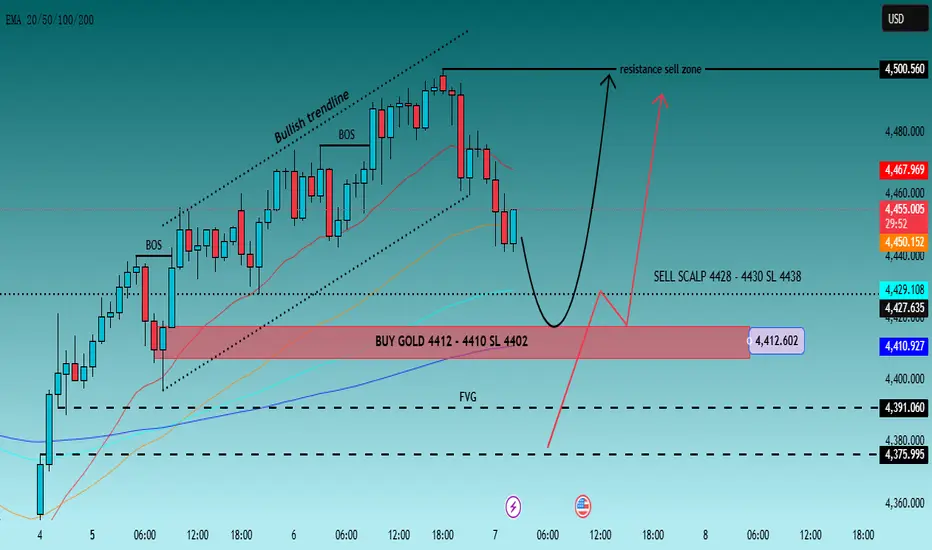
黄金回调,非持续,而是轮动🟡 XAUUSD – 日内智能资金计划 | 作者:Ryan_TitanTrader (07/01)
📈 市场背景
黄金在较高时间框架上仍然结构性看涨,经历了强劲的上涨扩张,价格深入到高端区域。然而,最近的价格走势信号显示,从扩张转向分配,智能资金开始实施纠正性旋转,而不是追逐继续上涨。
随着市场消化美元流动、美国收益率敏感性以及即将公布的美国数据前的布局,黄金目前在内部流动性区域之间旋转。这样的环境通常更青睐于流动性扫荡、诱导和均值回归,而不是干净的方向性突破。
今天的交易会最好以基于水平的执行、耐心和确认为主,而不是预测。
🔎 技术框架 – 智能资金结构 (1H)
当前阶段:
高时间框架看涨结构,当前存在从高端区域开始的日内修正腿。
关键理念:
期待智能资金在内部供应区域 (4428–4430) 反应进行短期分配,或在折扣需求区域 (4412–4410) 进行重新积累,以待下一波上涨。
结构性说明:
• 高时间框架看涨结构依旧完整
• 上涨扩张期间出现明显的突破
• 价格从高端区域 rejected,正向下旋转
• 4428–4430的内部供应区域作为卖出敏感区
• 4412–4410的需求与超买区 + EMA支撑 + 流动性口相符
💧 流动性区域与触发点
• 🟢 买入黄金 4412 – 4410 | SL 4402
• 🔴 卖出短线 4428 – 4430 | SL 4438
🧠 机构流动性预期
流动性扫荡 → MSS / CHoCH → 突破 → 位移 → 超买/公平价值回测 → 扩张
🎯 执行规则
🟢 买入黄金 4412 – 4410 | SL 4402
规则:
✔ 流动性扫荡进入折扣需求
✔ 在M5–M15的看涨MSS / CHoCH
✔ 明显的上行突破伴随位移
✔ 通过优化的看涨超买区或公平价值减轻入场
目标:
• 4425 — 初步反应
• 4435 — 内部流动性
• 4480–4500 — 如果动量扩张,则回测高端区域
🔴 卖出短线 4428 – 4430 | SL 4438
规则:
✔ 价格触及内部供应 / EMA阻力
✔ 低时间框架上的看跌MSS / CHoCH
✔ 确认分配的明显下行突破
✔ 通过看跌的公平价值补充或供应超买区入场
目标:
• 4418 — 首个不平衡
• 4410 — 需求互动
• 严谨跟踪(短线设置)
⚠️ 风险说明
• 高端区域有利于止损猎杀和虚假持续
• 在美国交易时段波动性可能扩张
• 没有MSS + 突破确认不进行入场
• 短线卖出需严格控制风险
📍 总结
黄金依旧结构性看涨,但今天的优势在于智能资金的日内旋转:
• 对4412–4410的扫荡可能重新加载多头,或
• 在4428–4430的反应提供一个受控的短线卖出机会回归需求。
让流动性先行。
让结构第二次确认。
智能资金操控者 — 耐心带来利润。⚡️
📌 关注Ryan_TitanTrader获取每日智能资金黄金解读。
XAUUSD智能资金水平:需求4325,供应4494🟡 XAUUSD – 日内智能资金计划 | 作者:Ryan_TitanTrader (05/01)
📈 市场背景
黄金在更高时间框架上依然结构性看涨,但当前价格走势反映的是溢价侧流动性操作,而不是清晰的持续性。在强劲的上涨阶段之后,价格现在在溢价区内旋转,智能资金通常会在此分配头寸,然后开始进行修正交付。
今天的重点围绕美元强势、美国收益敏感性和持续的美联储利率路径猜测,交易者在即将到来的美国宏观数据发布和美联储评论之前进行布局。随着实际收益波动和风险情绪保持脆弱,黄金仍继续吸引避险资金流入——但并非没有经过操控的回调。
这种环境有利于流动性扫荡、虚假持续和高位诱导,而非冲动的突破买入。
🔎 技术框架 – 智能资金结构 (1H)
当前阶段:
更高时间框架的看涨结构,带有从溢价区的短期修正腿。
关键观点:
预期智能资金在内部供给区(4492–4494)进行分配,或在高时间框架需求区(4327–4325)进行重新积累,然后再进行下一次扩张。
结构性笔记:
• 高时间框架的看涨结构仍然有效
• 最近的CHoCH确认修正旋转
• 高位的买方流动性部分被获取
• 4492–4494的供给集群作为分配区
• 4327–4325的需求区与OB + 流动性池相一致
💧 流动性区域与触发器
• 🟢 买入黄金 4327 – 4325 | SL 4317
• 🔴 卖出黄金 4492 – 4494 | SL 4500
🧠 机构流动性预期
流动性扫荡 → MSS / CHoCH → BOS → 位移 → OB/FVG回测 → 扩张
🎯 执行规则
🟢 买入黄金 4327 – 4325 | SL 4317
规则:
✔ 流动性扫荡进入高时间框架需求区
✔ M5–M30上的看涨MSS / CHoCH确认
✔ 强劲的向上BOS与冲动性蜡烛
✔ 通过精细化的看涨OB或FVG缓解进入
目标:
• 4390 — 初步位移
• 4450 — 内部流动性
• 4490+ — 如果美元走弱,则为溢价回测
🔴 卖出黄金 4492 – 4494 | SL 4500
规则:
✔ 在溢价供给区的反应
✔ 较低时间框架上的看跌MSS / CHoCH
✔ 明确的向下BOS确认分配
✔ 通过看跌FVG补充或供给OB进入
目标:
• 4455 — 首次失衡填补
• 4395 — 内部折扣
• 4327 — 高时间框架需求扫荡
⚠️ 风险笔记
• 溢价区有利于假突破和止损追击
• 在美国数据和美联储发言周围可能会出现波动性激增
• 没有MSS + BOS确认则不进行入场
• 停损往往在实际位移之前被触发
📍 总结
黄金仍然结构性看涨,但今天的优势在于交易智能资金的区间:
• 进入4327–4325的扫荡可能重新加载看涨头寸朝向4450–4490,或
• 在4492–4494的反应提供了回调做空的机会。
让流动性先行。
让结构后续确认。
智能资金的操盘者——耐心带来利润。⚡️
📌 关注Ryan_TitanTrader,获取每日智能资金黄金分析。

XAUUSD 智能资金水平:需求4312,供应4436🟡 XAUUSD – 日内智能资金计划 | 作者: Ryan_TitanTrader (05/01)
📈 市场背景
黄金在更高时间框架上结构性看涨,但短期价格走势显示在接近4440的优质流动性被选中后出现回调压力。随着市场因宏观催化因素(美联储评论、美国就业数据、国债收益率)而做好应对美元方向的准备,机构参与在流动性搜索与受控再积累之间摇摆。
全球风险情绪和避险购买加剧,交易者在权衡通胀的发展与央行政策转向预期——这导致黄金表现出轮换分布行为而非干净的延续。受控的波动和扫盘驱动的走势主导价格进展。
这种环境有利于工程化流动性获取和诱导,而非盲目追逐突破。
🔎 技术框架 – 智能资金结构 (1H)
当前阶段:
更高时间框架上看涨偏向伴随短期修正位移。
关键思路:
在HTF需求附近(约4312–4314)或内部供应流动性附近(约4434–4436)期待结构性参与,然后再出现有意义的位移序列。
结构性备注:
• HTF看涨结构保持完好
• 最近的CHoCH确认修正腿
• 最近高点上方的买方流动性成为目标
• 4436附近的供应簇作为工程化诱饵
• 需求汇聚与机构积累一致
💧 流动性区域与触发点
• 🟢 买入黄金 4314 – 4312 | SL 4304
• 🔴 卖出黄金 4434 – 4436 | SL 4444
🧠 机构流动性预期
流动性扫荡 → MSS / CHoCH → BOS → 位移 → 内部供应回测 → 扩张
🎯 执行规则
🟢 买入黄金 4314 – 4312 | SL 4304
规则:
✔ 流动性扫荡进入HTF需求
✔ M5–M30的看涨MSS / CHoCH确认
✔ 清晰的上行BOS和冲击蜡烛
✔ 通过细化的需求OB或FVG填充入场
目标:
• 4370 — 初始位移
• 4410 — 内部供应测试
• 4440+ — 如果美元走弱则延续运行
🔴 卖出黄金 4434 – 4436 | SL 4444
规则:
✔ 对内部供应簇的反应
✔ 看跌MSS / CHoCH汇聚
✔ 下行BOS伴随动量转变
✔ 通过看跌FVG补充或供应OB入场
目标:
• 4390 — 第一个折扣区
• 4350 — 更深的回调
• 4314 — HTF需求扫描
⚠️ 风险备注
• 近乎薄弱的亚洲交易时段可能会出现假突破
• 宏观催化因素(美国数据、美联储发言人)可能引发波动性激增
• 避免没有MSS + BOS确认的入场
• 被工程化流动性搜索触发的止损
📍 总结
黄金在结构上仍然看涨,但今天的优势在于有纪律的入场和流动性意识:
• 一次扫荡进入4312–4314可能会重新加载多头,目标高达4410–4440,或者
• 在4434–4436附近的反应提供了回调至折扣的机会。
让流动性引发移动。让结构确认。
智能资金设下陷阱——散户追逐它们。⚡️
📌 关注Ryan_TitanTrader获取每日智能资金黄金分析。

聪明资金是否在最新流动性扫荡后重新增持黄金?🟡 XAUUSD – 日内智能资金计划 | 作者:Ryan_TitanTrader (30/12)
📈 市场背景
黄金在较高时间框架上仍然结构性受到支撑,但当前价格走势反映出控制波动性和流动性工程,而非趋势延续。
由于市场对美国新数据预期的反应、美元收益波动和不断的地缘政治不确定性,黄金继续吸引避险兴趣——但扩展的日内区间表明智能资金正在积极布局,而非追逐价格。
有关美联储利率路径不确定性和混合的美国宏观信号的最新头条使得黄金在回调时保持买盘,而年末交易时段的流动性稀薄增加了在区间两侧进行止损猎杀和工程陷阱的可能性。
智能资金的行为偏向于先提取流动性,然后确认结构——而不是干净的突破。
🔎 技术框架 – 智能资金结构 (1H)
当前阶段:
高时间框架牛市结构,短期修正压缩
关键概念:
预计在折扣区间(4320–4318)与流动性互动,或者在内部供给(4465–4467)反应后,才会有持续的位移。
结构性注意事项:
高时间框架牛市BOS仍然有效
之前的CHoCH触发了修正腿
价格正压缩于看跌趋势线下
折扣区间与潜在积累一致
买方流动性位于内部高点之上
卖方流动性最近被探测并吸收
💧 流动性区间与触发器
• 🟢 买入黄金 4320 – 4318 | SL 4310
• 🔴 卖出黄金 4465 – 4467 | SL 4475
🧠 机构流动预期
流动性扫荡 → MSS / CHoCH → BOS → 位移 → FVG / OB回测 → 扩张
🎯 执行规则
🟢 买入黄金 4320 – 4318 | SL 4310
规则:
✔ 进入折扣区的流动性抓取
✔ M5–M15的牛市MSS / CHoCH
✔ 清晰的向上BOS伴随冲击位移
✔ 通过牛市FVG填充或精细要求OB入场
目标:
4360
4400
4465 – 如果美元走弱和风险情绪恶化则延伸
🔴 卖出黄金 4465 – 4467 | SL 4475
规则:
✔ 进入内部供给 / 溢价失衡的反应
✔ LTF的看跌MSS / CHoCH
✔ 动能转变的下行BOS
✔ 通过看跌FVG重新填充或供给OB入场
目标:
4430
4385
4320 – 如果美元走强或收益上升则延伸
⚠️ 风险提示
压缩有利于虚假突破
没有MSS + BOS确认就不执行
在美国交易时段要预期波动性
在美元收益飙升或美联储相关头条时减少风险
流动性稀薄会加剧止损猎杀
📍 总结
黄金在结构上仍然看涨,但今天的优势在于耐心,而非预测。
智能资金可能会在承诺之前进行流动性工程:
• 一次扫荡进入4320–4318可能会重新加载多头,朝向4400–4465,或者
• 在4465–4467附近的反应可能会将价格回落至折扣区间。
让流动性先行。让结构确认。
智能资金在等待——零售在反应。⚡️
📌 关注 @Ryan_TitanTrader 获取每日智能资金黄金分析。

黄金1小时 - 智能资金分析目标4040流动性🟡 XAUUSD – 日内智能资金计划 | 作者:Ryan_TitanTrader (30/12)
📈 市场背景
黄金在年末定位流动后遭遇了一次剧烈的下跌,标志着其几个星期以来最大的单日跌幅。根据今天的热更新ForexFactory,市场的看空势头在加速,因为价格果断突破了关键技术水平,下行目标现在对准$4040–4050的流动性区间。
这一走势似乎更多是由投资组合重新平衡、获利了结和典型于12月末的低流动性条件驱动,而非新的宏观催化剂。尽管日内出现了一些低买兴趣,但整体流动更倾向于分配而非积累,使得黄金在可持续回升前仍然容易遭受进一步的下行冲击。
在这种环境中,智能资金的行为更倾向于卖方的持续,而不是冲动的趋势反转。
🔎 技术框架 – 智能资金结构 (1H)
当前阶段:结构分解后的看空位移
关键观点:卖出高价回撤;只在深度折扣流动性时买入
结构说明:
• 在失去之前的看涨结构后确认了清晰的CHoCH
• 强烈的看空位移在下方创造了无效性
• 先前的看涨趋势线被否定
• 价格在均衡线以下交易,尝试进行微弱的修正回撤
• 内部流动性部分清除;外部卖方流动性位于下方
• 阻力区对准先前的供应和突破来源
💧 流动性区与触发器
• 🔴 卖出黄金 4480 – 4490 | SL 4500
• 🟢 买入黄金 4310 – 4320 | SL 4300
🧠 机构流动预期
流动性扫荡 → MSS / CHoCH → BOS → 位移 → FVG / OB 回测 → 持续
🎯 执行规则(与您确切的区域匹配)
🔴 卖出黄金 4480 – 4490 | SL 4500
规则:
✔ 回撤至高价阻力 / 供应
✔ M5–M15上的看空MSS或CHoCH
✔ 价格的看空BOS伴随冲动位移
✔ 通过看空FVG补充或精炼供应OB入场
目标:
4420
4370
4310 – 如果看空势头持续则延伸
🟢 买入黄金 4310 – 4320 | SL 4300
规则:
✔ 卖方流动性扫荡至深度折扣
✔ 看涨MSS / CHoCH确认吸收
✔ 价格的看涨BOS伴随强烈的看涨位移
✔ 通过看涨FVG填充或需求OB回测入场
目标:
4370
4420
4480 – 仅在结构翻转为看涨时
⚠️ 风险说明
• 看空势头在结构突破后主导
• 年末流动性增加了假回撤和止损狩猎
• 没有MSS + BOS确认不交易
• 在美国交易时段和美元收益率头条附近预期波动性
• 如果波动性意外扩大,减少头寸规模
📍 总结
黄金已从积累转向分配,智能资金现在倾向于向更深的流动性池继续下行。计划明确:
• 在4480–4490卖出高价回撤,或者
• 仅在确认后在深度折扣4310–4320买入
让流动性被引导。
让结构确认意图。
智能资金在等待——散户在反应。⚡️
📌 关注Ryan_TitanTrader,获取每日智能资金黄金解析。

Gold 1H – 美联储主席猜测主导 Smart Money 流向🟡 XAUUSD – 日内 Smart Money 交易计划 | by Ryan_TitanTrader (16/12)
📈 市场背景
黄金目前处于流动性主导的区间震荡中,市场聚焦今日热点:NFP 预期以及美联储利率路径的不确定性。
最新的 NFP 预览显示,就业增速放缓与薪资压力仍然偏强之间存在分化,令 DXY 资金流动不稳定。在这种环境下,在方向确认之前,市场更容易出现止损猎杀与流动性扫荡,而非干净利落的单边走势。
因此,Smart Money 更可能在真正扩张前,将价格引导至清晰的溢价(Premium)与折价(Discount)区域。
🔎 技术框架 – Smart Money 结构(1H)
当前阶段: 扩张后,在更大级别看涨背景下,CHoCH 之后进入盘整
核心思路: 预期先扫向溢价区(4352–4354)或折价区(4272–4270),随后才出现下一段冲量走势
结构要点:
• 高周期 BOS 维持整体看涨偏向
• 近期回调反映的是分配/获利了结,而非确认反转
• 4350 上方等高与 4270 下方卖方流动性清晰暴露
流动性区域 & 触发条件:
• 🔴 SELL GOLD 4352 – 4354 | SL 4362
• 🟢 BUY GOLD 4272 – 4270 | SL 4262
机构资金流预期:
sweep → MSS / CHoCH → BOS → 位移(displacement) → FVG / OB 回测 → 扩张
🎯 执行规则(严格对应你的区间)
🔴 SELL GOLD 4352 – 4354 | SL 4362
规则:
✔ 价格扫过近期高点,进入溢价区
✔ M5–M15 出现看跌 MSS / CHoCH
✔ 向下 BOS 并伴随强势看跌位移
✔ 通过看跌 FVG 回补或精炼供给 OB 进场
目标位:
4325
4300
4285 —— 若动能加速则延伸
🟢 BUY GOLD 4272 – 4270 | SL 4262
规则:
✔ 跌破等低位 / 动态支撑,完成流动性抓取
✔ 看涨 MSS / CHoCH 确认需求接管
✔ 向上 BOS 并出现冲量位移
✔ 通过看涨 FVG 回补或需求 OB 回测进场
目标位:
4285
4310
4350 —— 若数据后美元走弱则延伸
⚠️ 风险提示
• NFP 相关仓位可能引发假突破——等待结构确认,而非首个冲刺
• 未出现明确 MSS + BOS 前避免交易
• 美盘时段注意点差与波动率放大
• 临近重要数据发布时降低风险
📍 总结
今日黄金的核心逻辑由 NFP 引发的利率路径不确定性 所定义:
• 若先扫至 4354,可能引导看跌结构回落至 4300–4285
或
• 若在 4270 附近完成流动性抓取,或将重启看涨动能,指向 4310–4350
让结构来确认方向 —— Smart Money 做出反应,散户提前预判。 ⚡️
📌 关注 @Ryan_TitanTrader,获取每日 Smart Money 黄金解析。

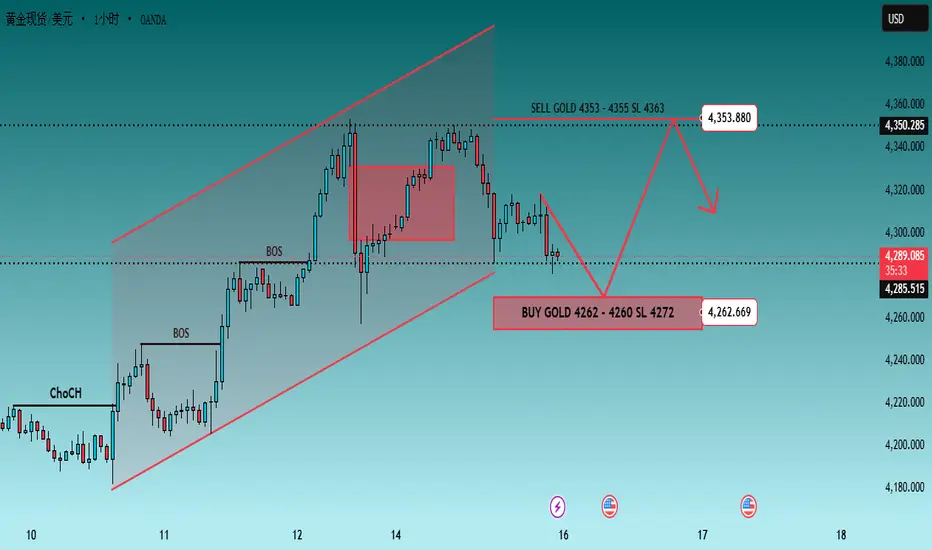
Gold 1H – NFP 主导市场:4355 是顶部,还是 4260 能守住?🟡 XAUUSD – 日内 Smart Money 交易计划 | by Ryan_TitanTrader (16/12)
📈 市场背景
在市场消化 NFP 前瞻:利率路径分化及其对 DXY 与黄金的影响 之际,黄金正处于高波动、高流动性的交易环境中。
即将公布的美国就业数据将影响市场对美联储 2026 年利率路径的预期,美元资金流动因此保持不稳定。就业或薪资数据的任何意外,都可能引发降息预期的快速重新定价,并通过美元指数(DXY)的波动直接影响黄金。
在这种环境下,机构资金不太可能过早确定方向,更倾向于在关键的 premium / discount 区域进行 流动性博弈与止损扫盘,随后才出现真正的位移(displacement)。
🔎 技术结构 – Smart Money 视角(1H)
当前阶段: 扩张之后,价格在上升通道内震荡,并在均衡区附近暂停
核心思路: 在下一轮强势推动前,预期价格将先扫向 premium 区(4353–4355) 或 discount 区(4262–4260) 以获取流动性
结构要点:
• 先前的 BOS 确认了高时间框架的看涨背景
• 最近的回调更像是获利了结,而非趋势反转
• 4350 上方存在明显等高点,下方 4260 存在清晰的卖方流动性
流动性区域 & 触发条件:
• 🔴 SELL GOLD 4353 – 4355 | SL 4363
• 🟢 BUY GOLD 4262 – 4260 | SL 4272
机构资金预期路径:
Sweep → MSS / CHoCH → BOS → Displacement → FVG / OB 回测 → 扩张
🎯 执行规则(严格对应给定区域)
🔴 SELL GOLD 4353 – 4355 | SL 4363
规则:
✔ 价格在 premium 区上方扫过近期高点获取流动性
✔ M5–M15 出现看跌 MSS / CHoCH
✔ 向下 BOS,伴随强烈的看跌位移
✔ 通过看跌 FVG 回补或精细化的供给 OB 入场
目标:
4325
4300
4285 —— 动能加速时的延伸目标
🟢 BUY GOLD 4262 – 4260 | SL 4272
规则:
✔ 跌破等低点 / 通道支撑以获取流动性
✔ 出现看涨 MSS / CHoCH,确认需求接管
✔ 向上 BOS,伴随强势位移
✔ 通过看涨 FVG 回补或需求 OB 回测入场
目标:
4280
4310
4350 —— 数据公布后若 USD 走弱可延伸
⚠️ 风险提示
• NFP 前后的仓位调整可能引发假突破 —— 等结构确认,而非第一根尖刺
• 没有明确 MSS + BOS 确认时避免交易
• 美盘时段点差与波动性可能明显扩大
• 接近重要数据公布时应降低风险
📍 总结
今日黄金的主线由 NFP 引发的利率路径不确定性主导:
• 若向 4355 扫盘,可能引导价格回落至 4300–4285 的看跌结构
或
• 若在 4260 附近获取流动性,可能重新加载看涨动能,指向 4310–4350
让结构来确认 —— Smart Money 反应,散户预判。⚡️
📌 关注 @Ryan_TitanTrader,获取每日 Smart Money 黄金解析。
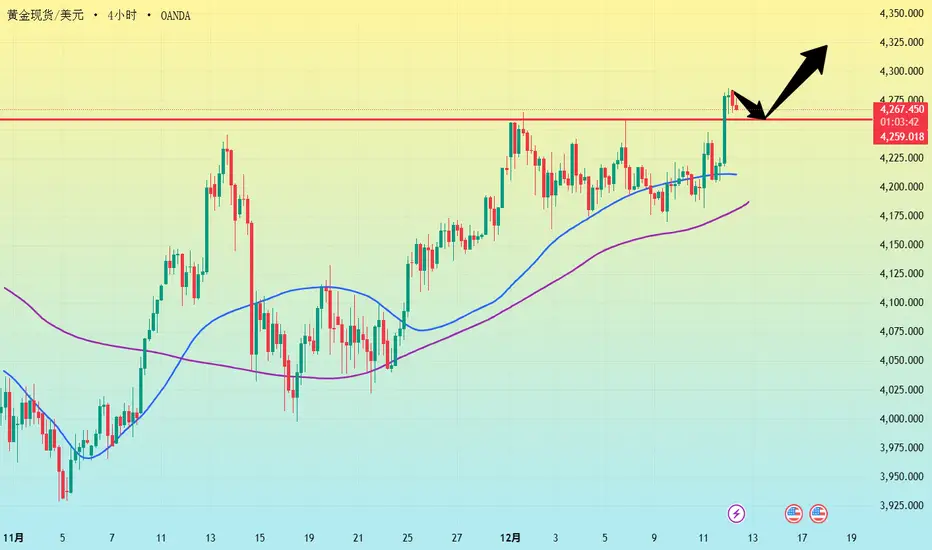
Latest gold price trend analysis today!Market News:
On Friday (December 12th) in early Asian trading, spot gold fluctuated narrowly, currently trading at $4270 per ounce. The dollar was sold off following the Fed's decision, and weak US unemployment claims data put pressure on the dollar, accelerating the rise in international gold prices. This prompted a surge in spot gold overnight, reaching a more than one-month high, with international gold rising nearly $80, reaching a high of $4285. In addition, silver hit a new historical high, which also boosted London gold prices.
With the release of non-farm payroll data and the evolution of geopolitical situations, the gold market may see more opportunities, but potential pullback risks should be noted, such as the Fed pausing interest rate cuts or an unexpectedly strong global economy. Overall, gold still has strong upward momentum, and long-term holders are advised to pay attention to tools such as ETFs to seize the wealth opportunities brought by this safe-haven wave. In addition, the speeches of Fed officials should be noted during this trading day.
Technical Analysis:
Gold's strong rally, following expectations, broke through 4280 and reached a new monthly high of 4286. The daily chart shows a large bullish candle, with the 10-day and 7-day moving averages opening upwards, and the price trading along the upper Bollinger Band. The hourly and 4-hour charts also show a bullish crossover of moving averages across different timeframes, and the Bollinger Bands are widening upwards. The trading strategy for gold remains unchanged: buy on dips during the day. From a 4-hour technical perspective, gold broke through the upper Bollinger Band resistance with a strong bullish candle, simultaneously breaching recent highs. The current price is firmly above the upper band, indicating a strong buy trend. Future analysis should focus on two key levels: the 4300 ounce level as resistance; a successful break and hold above this level could open up further upside potential. On the downside, the 4220 ounce level is crucial support, serving as the midpoint of the recent trading range and providing strong technical support.
Gold Trading Strategy:
Buy gold at 4230-4235 (short-term), stop-loss at 4220, target 4280-4300; Sell gold at 4300-4305 (short-term), stop-loss at 4320, target 4220-4200;
Key Levels:
First Support: 4255, Second Support: 4240, Third Support: 4222
First Resistance: 4290, Second Resistance: 4312, Third Resistance: 4328
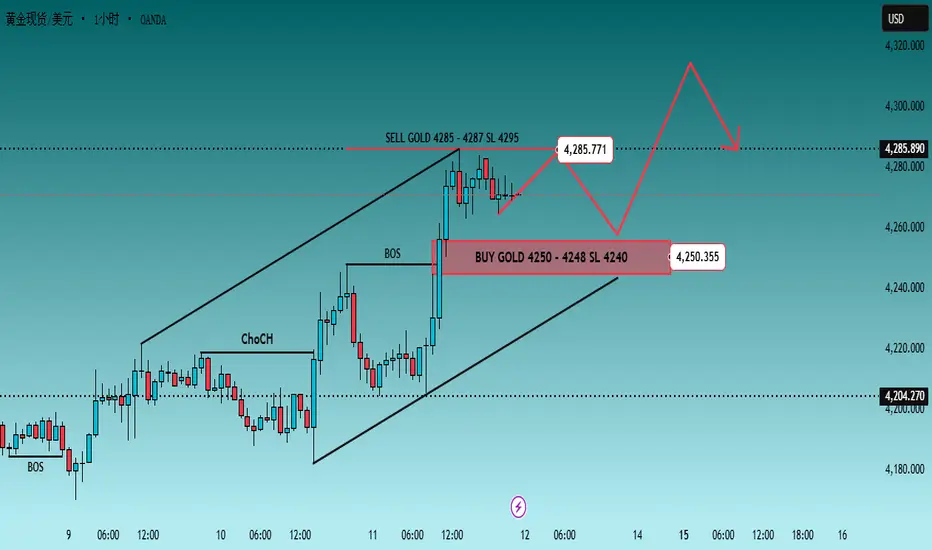
Gold 1H Will 4287 Liquidity Cap Price or 4248 Reload Demand?🟡 XAUUSD – 日内 Smart Money 交易计划 | by Ryan_TitanTrader (12/12)
📈 市场背景(Market Context)
在美国前总统唐纳德·特朗普表示其*“继承了历史上最严重的通胀”*、但目前通胀正在快速降温之后,黄金对政治与通胀叙事依然高度敏感。
这一表态加剧了市场对通胀预期及未来利率路径的不确定性,使美元(USD)日内资金流动保持不稳定。
在这样的环境下,黄金更容易出现被设计的流动性扫单(Liquidity Sweep),而非干净利落的单边趋势延续,因为机构同时利用通胀对冲需求与美元的短期强势。
在 H1 周期上,价格运行于上升结构中,上方近期高点聚集明确流动性,下方中位区间堆积买盘——这是一个典型的 Smart Money 形态。
🔎 技术框架 – Smart Money 结构(1H)
当前阶段: BOS 之后的扩展阶段,正在高位(Premium)区域暂停
核心思路: 在真正的位移(Displacement)出现前,预计价格将先扫向高位流动性(4285–4287)或低位折价区(4250–4248)
结构要点:
• 先前的 BOS + CHoCH 确认多头背景
• 价格当前在上升通道内进行反应
• 上下两端的流动性分布非常清晰
流动性区间 & 触发位:
• 🔴 SELL GOLD 4285 – 4287 | SL 4295
• 🟢 BUY GOLD 4250 – 4248 | SL 4240
机构资金流预期:
扫流动性 → MSS/CHoCH → BOS → 位移 → FVG/OB 回踩 → 扩展
🎯 执行规则(严格对应你的区间)
🔴 SELL GOLD 4285 – 4287 | SL 4295
规则:
✔ 价格在高位(Premium)扫过近期高点流动性
✔ M5–M15 出现空头 MSS / CHoCH
✔ 向下 BOS,伴随清晰的空头位移
✔ 通过空头 FVG 回补或精细化供应区 OB 进场
目标位:
4270
4258
4250 – 4248
🟢 BUY GOLD 4250 – 4248 | SL 4240
规则:
✔ 在通道支撑 / 等低点下方抓取流动性
✔ 多头 MSS / CHoCH 确认需求接管
✔ 从折价区出现向上 BOS + 强势位移
✔ 通过多头 FVG 回补或需求区 OB 回踩进场
目标位:
4265
4280
4287 —— 若动能延续则进一步扩展
⚠️ 风险提示(Risk Notes)
• 特朗普关于通胀的言论可能引发情绪快速反转 → 等结构确认,不追逐新闻
• 没有清晰 BOS + 位移,不要入场
• 避免在区间中部的噪音区域交易
• 美国重要新闻时段若波动放大,需降低仓位
📍 总结(Summary)
今日黄金的核心逻辑是纯粹的流动性工程:
• 4287 的扫单可能触发空头结构,回落至 4250
或
• 4248 的流动性抓取可能重新加载多头动能,指向 4280–4287
让结构来确认方向 ——
Smart Money 负责反应,散户负责预测。 ⚡️
📌 关注 @Ryan_TitanTrader,获取每日黄金 Smart Money 深度解析。
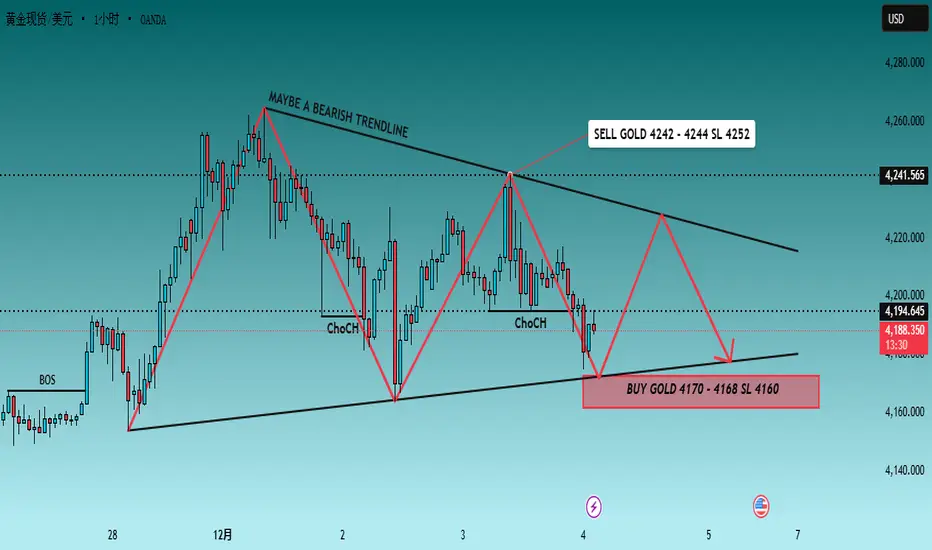
黄金1小时 – 4242会取代还是4170会解锁下一步?🟡 XAUUSD – 日内聪明资金计划 | 作者:Ryan_TitanTrader (04/12)
📈 市场背景
黄金挤入人为设计的流动性中,因唐纳德·特朗普发出信号,授权在美国生产超紧凑型汽车,为美元叙述增加了风险偏好波动性。市场可能会提前转向黄金等商品。预计在机构揭示意图之前会有快速的双向扫荡。
在1小时图上,结构在4242–4244的优质供应和4170–4168的折扣需求之间切换。下一个方向性步骤需要MSS + BOS + 位移汇合。
🔎 技术框架 – 聪明资金结构 (1H)
当前阶段 = 1小时极端的流动性丰富压缩
流动性区域和关键触发点
• 🔴 卖出黄金 4242 – 4244 | 止损 4252
• 🟢 买入黄金 4170 – 4168 | 止损 4160
只有通过结构突破 + 位移验证才能使偏见无效。
预期序列 = 扫荡 → MSS/CHoCH → BOS → 位移 → 回测 → 扩展
🎯 执行规则(不变的方法,匹配您的区域)
🔴 卖出黄金 4242 – 4244 | 止损 4252
规则:
✔ 区域触及 4243 → 看跌 MSS/CHoCH (M5–M15)
✔ 清晰的看跌 BOS 下行 + 烛台位移
✔ 在FVG填充或OB回测后位移时入场
目标:
1. 4200 – 4190
2. 4182 – 4176
3. 4170 – 4168
🟢 买入黄金 4170 – 4168 | 止损 4160
规则:
✔ 低于 4169 扫荡 → 看涨 MSS/CHoCH + BOS 上行
✔ 从折扣中位移的烛台
✔ 烛芯拒绝进入FVG填充 / OB回测确认
目标:
1. 4186
2. 4210
3. 4242+
⚠️ 风险提示
• 两次扫荡 = 陷阱,直到BOS + 位移确认意图
• 不在压缩中平均
• 止损 = 仅结构无效
• 在头条驱动的尖峰期间减少规模
📍 总结
今天的两个机构路径:
• 4243 扫荡 → 看跌 MSS/BOS → 回测 → 交付至 4170
或
• 4169 扫荡 → 看涨 MSS/BOS → 回测 → 扩展至 4242+
交易结构。让价格叙述意图。耐心 = 优势。🚀
📌 关注 @Ryan_TitanTrader 获取每日聪明资金分析。
黄金1小时 – 4262扫荡会引发下跌还是4188今天能撑住底部?🟡 XAUUSD – 日内聪明资金计划 | 作者:Ryan_TitanTrader (03/12)
📈 市场背景
黄金正在进行政策驱动的流动性工程,因为前白宫顾问凯文·哈塞特在前美国总统唐纳德·特朗普提到可能影响美联储领导层后重新受到关注。预计在机构承诺之前,两边都会有剧烈的流动性扫荡。
技术上,H1价格在溢价和折扣极端之间盘整,只有在MSS(CHoCH)+ BOS + 位移验证后,下一步才会解锁。
🔎 技术框架 – 聪明资金结构(1小时)
当前阶段 = H1极端的流动性丰富压缩
流动性区域和关键触发点
• 🔴 卖出黄金 4265 – 4267 | 止损 4275
机构想法:扫荡溢价上方 → 看跌MSS + 有效BOS下行 → FVG/OB回测 → 交付至折扣。
• 🟢 买入黄金 4186 – 4184 | 止损 4176
机构想法:扫荡折扣下方 → 看涨MSS + BOS上行 → FVG/OB回测 → 需求扩张。
• 🟡 平衡 / 盘整:除非结构证明意图,否则不交易。
预期序列 = 扫荡 → MSS/CHoCH → BOS → 位移 → 回测 → 扩张
🎯 执行规则(不变的方法,匹配您的区域)
🔴 卖出黄金 4265 – 4267 | 止损 4275
规则:
✔ 价格触及4266区域 → 看跌MSS/CHoCH(M5–M15)
✔ 确认干净的看跌BOS下行伴随位移
✔ 在FVG填充或OB回测后进入
目标:
1. 4245 – 4240
2. 4225 – 4215
3. 4186 – 4184
🟢 买入黄金 4186 – 4184 | 止损 4176
规则:
✔ 价格扫荡4185 → 看涨MSS/CHoCH + BOS上行
✔ 确认远离折扣的位移
✔ 在烛芯拒绝 + FVG填充或OB回测确认后进入
目标:
1. 4215
2. 4240
3. 4265+
⚠️ 风险提示
• 两次扫荡 = 陷阱,直到BOS + 位移证明意图。
• 不在压缩中平均化。
• 止损 = 仅结构失效。
• 在头条风险引发的波动高峰期间减少手数。
📍 总结
今天有两条机构路线:
• 4266扫荡 → 看跌MSS/BOS → 回测 → 交付至4185
或
• 4185扫荡 → 看涨MSS/BOS → 回测 → 扩展至新的4266+
交易结构。让价格叙述意图。耐心 = 优势。
📌 关注@Ryan_TitanTrader获取每日聪明资金解析。

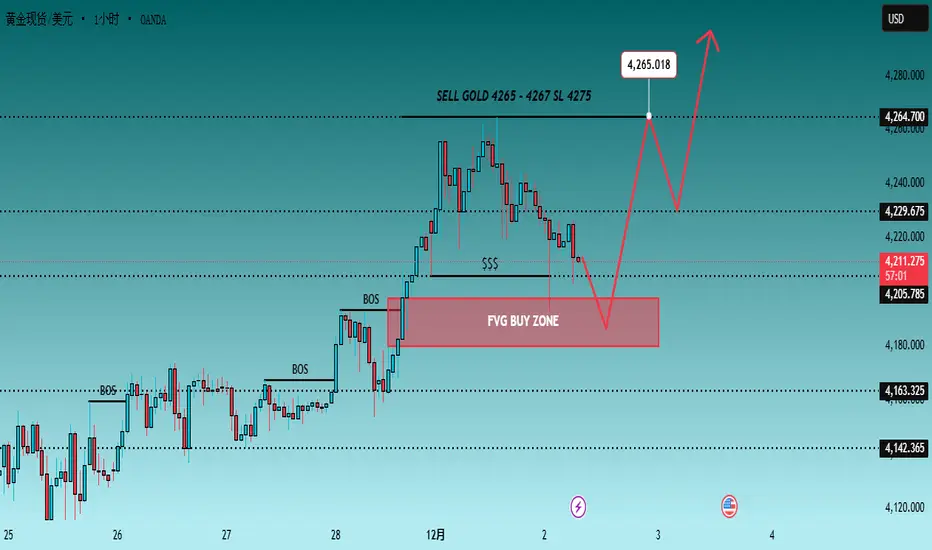
Gold 1H – 4265 是突破还是 4185 的诱多陷阱?🟡 XAUUSD – 日内智能资金交易计划 | 作者: Ryan_TitanTrader (02/12)
📈 市场背景
黄金持续强势上涨,市场正在押注 美联储 可能在12月降息。美元指数(DXY) 走弱,使现货黄金创下数周新高。整体市场情绪偏向鸽派:USD疲软与降息预期继续支撑黄金需求。
从技术面来看,价格在上升通道顶部压缩震荡,符合机构在开启下一段行情前进行流动性猎取的典型行为。 ForexFactory 上Powell的开场讲话将进一步放大日内波动。
🔎 技术框架 – 智能资金结构 (H1)
当前状态 = 上升通道内的 吸筹 / 释放
关键流动性区域与触发点
溢价区 (SELL 机会):~4265–4267(通道顶部流动性池)
折价区 (BUY 起点 / 重新入场):~4186–4184(位于位移基底的需求流动性)
均衡震荡区 / 杂乱区 (Chop Zone):通道中部 → 结构确认前避免盲目交易
智能资金预期路径
扫荡流动性(Sweep) → 结构转向确认(CHoCH/MSS) → 突破结构(BOS) → 价格位移(Displacement) → 回测(FVG/OB Retest) → 行情扩展(Expansion)
黄金只在结构确认方向意图后才具备明确单边行情条件。
🎯 今日交易计划
🔴 SELL GOLD 4265 – 4267 | 止损 SL 4275
• 逻辑:在溢价区上方扫荡等顶流动性,随后形成机构设计的Bearish BOS,确认做空意图并交付折价。
• 入场规则(必须等待确认):
✔ 价格探入 4266 区域 → 形成M5–M15 Bearish CHoCH/MSS + BOS下破
✔ 在BOS有效后,于FVG回补或Order Block回测入场
• 目标位(分批TP):
4245 – 4240 (首次反应区)
4225 – 4215 (通道均衡回测)
4186 – 4184 (最终交付至折价区)
🟢 BUY GOLD 4186 – 4184 | 止损 SL 4176
• 逻辑:在折价流动性区扫荡后形成机构BUY吸收,Bullish BOS确认新的日内需求推动。
• 入场规则(必须等待确认):
✔ 价格扫荡 4185 → 形成M5–M15 Bullish CHoCH/MSS + BOS 上破
✔ 通过强势反转K线(Fakeout Rejection Wick) + FVG回补或OB回测确认入场
• 目标位(分批TP):
4215
4240
4265+
⚠️ 风险管理与注意事项
价格未出现CHoCH/BOS确认前,通道中部均视为陷阱区域。
止损 SL 只用于结构否定,不在流动性压缩内加仓或平均成本。
Powell讲话期间建议降低仓位手数与风险敞口。
📌 总结
黄金正在通道顶部酝酿流动性猎取行情。方向二选一:
Powell推动4266流动性扫荡 → Bearish BOS → 下行交付
或:
机构将价格回拉至4185折扣流动性区 → Bullish BOS → 继续上行趋势。
交易基于结构确认,而非消息叙事。等待CHoCH & BOS + 回测信号开启扩展。
📍 关注 @Ryan_TitanTrader 获取每日智能资金更新。
黄金4小时图 – XAUUSD能否在跌至4140之前拒绝4245?📈 市场背景
由于美联储降息预期重新定价,美国美元收盘走软,黄金上涨,市场头条确认美元收低,黄金因降息时机辩论而上涨——这种设置鼓励在每周方向揭示之前进行外部流动性掠夺。Forex Factory
4小时条件是流动性工程的经典:价格在平衡的中间流动附近交易,机构利用美元疲软进入每周开盘,买卖双方的资金池在扩展前容易受到战略性扫荡。
预计美国交易时段开盘和PMI头条催化剂周围会出现波动性飙升。
🔎 技术分析(4小时/ SMC视角)
🟢 买入区:4140–4138
止损:4130
获利目标:4175 → 4200 → 4220 → 4250 → 4280+
理由:
• 4小时流动性架下的折扣区
• 扫荡后的需求缓解+积累叙述
🔴 卖出区:4245–4247
止损:4255
获利目标:4220 → 4200 → 4175 → 4150 → 4140
理由:
• 高于等高流动性的优质供应
• 4小时不平衡磁铁在下方等待填补
⚠️ 风险管理注意事项
• 等待M15 ChoCH / BOS确认后再进入——避免盲目定位。
• 预计美元头条发布时会出现更宽的点差和影线操控。
• 避免在高影响力的美元新闻(PMI,美联储发言人)发布前10-20分钟内交易。
• 在每个获利目标水平缩减部分,让跑步者仅在确认打印后工作。
总结
黄金仍处于4小时区间工程领域,聪明资金可能会扫荡高于4245的溢价,进行修正至4140,然后在确认的美元波动性中寻求经过验证的看涨反应。
耐心和确认优先。流动性总是胜利。
🚀 关注@Ryan_TitanTrader获取更多每周SMC设置

黄金4小时 – 美联储会议纪要和PMI数据前的流动性策略🥇 XAUUSD – 每周聪明资金展望 | 作者:Ryan_TitanTrader
📈 市场背景
黄金继续在一个受控的4小时整合中交易,市场准备迎接一个高度事件驱动的周:美国PMI发布、更新的美联储指引,以及关于未来降息时机的新辩论。
最近的数据显示出混合的动能——就业趋势较软但商业活动稳定——使得美元波动,黄金在中间流动性附近反应。
机构资金流保持谨慎,在主要宏观催化剂前减少激进头寸。这种环境通常导致在区间两侧进行设计的扫荡,因为聪明资金在揭示方向之前寻找流动性。
预计短期波动性激增,尤其是在美国交易时段开盘和PMI发布时。
🔎 技术分析(4小时/聪明资金视角)
• 价格正在导航一个小幅看跌结构,形成更低的高点,同时保护4020下方的更深流动性。
• 最近的4小时结构突破+修正回调表明市场可能在任何强劲的看涨走势发展之前,向折扣区生成流动性抓取。
• 4225–4227的溢价卖出区位于静止流动性之上,是止损猎取和短期分配的理想区域。
• 4010–4008的折扣买入区与结构反应点、未缓解需求和流动性架构一致——理想的积累区域。
• 4060–4080附近的中间流动性可能在市场选择更大的每周方向之前被扫荡。
🟢 买入区:4010–4008
止损:4000
止盈目标:4085 → 4120 → 4175 → 4220
理由:
• 4小时流动性下方的深度折扣区
• 需求与结构缓解的汇合
• 在看涨扩展前高概率的设计扫荡
🔴 卖出区:4225–4227
止损:4235
止盈目标:4175 → 4120 → 4060 → 4015
理由:
• 等高流动性之上的溢价供应
• 有利于止损猎取+分配前的修正
• 与之前的4小时拒绝和不平衡填补一致
⚠️ 风险管理注意事项
• 在每个区域内等待M15结构变化/结构突破后再进入——避免盲目进入。
• 预计新闻周围的点差和流动性操控:美国PMI、美联储讲话和数据意外。
• 避免在高影响事件前10–20分钟交易。
• 在每个结构目标处缩减部分利润以确保收益并让跑者发展。
✅ 总结
黄金仍被困在一个结构化的4小时区间内,聪明资金可能在交付决定性扩展前扫荡一侧。
4010–4008的折扣买入和4225–4227的溢价卖出仍是最高概率的每周设置。
保持耐心,尊重流动性,并遵循确认。
🔔 关注 @Ryan_TitanTrader 获取更多每周聪明资金设置 🚀

黄金H1 - 黄金能否拒绝4167并在今天跌至4133?🟡 XAUUSD – 日内聪明资金计划 | 作者:Ryan_TitanTrader (27/11)
📈 市场背景
黄金在强劲的H1位移后处于日内盘整中。当前的交易时段已准备好进行流动性工程,以迎接下一步。
交易者今天必须尊重的关键叙述驱动因素:
• 更强的美元预期继续影响风险情绪
• 机构交易台在盘整期间经常利用扫荡区
• 区间波动条件有利于假突破 → 位移 → 扩展机制
• 美国货币政策基调的头条新闻放大了日内波动性
当前图表突出显示了结构上下方的平衡流动性,支持双向SMC剧本。
🔎 技术框架 – 聪明资金结构 (H1)
市场保持上升通道,但内部波动——典型的流动性地图场景:
• 买方流动性口袋:4180 → 4182(溢价极端)
• 卖方流动性池:4110 → 4133(折扣极端/起源区)
• 内部平衡区:4150–4170 波动区域(无交易区)
我们预计这一序列:
扫荡 → CHoCH/BOS → 位移 → 回测 → 扩展。
🎯 今日交易计划
🔴卖出黄金 4180–4182 | 止损 4190
论点:在本地高点上方进行溢价流动性扫荡,然后向下位移。
激活规则:
• 价格扫荡4182流动性
• M5–M15上出现看跌CHoCH/MSS + BOS
• 结构突破后不平衡回测/FVG进入
目标:
• 4167(最近反应)
• 4150(平衡突袭)
• 4135–4133(折扣回测)
🟢买入黄金 4135–4133 | 止损 4125
论点:卖方流动性扫荡进入起源区,然后向上冲动。
激活规则:
• 价格触及4133池(结构下方扫荡)
• M5–M15上出现看涨CHoCH/MSS + BOS
• FVG填充/看涨拒绝影线确认
目标:
• 4155+
• 4167(回收区)
• 4180+(溢价突袭目标)
⚠️ 风险管理
• 在没有明确位移的情况下,不要在4150–4170内交易
• 执行前等待CHoCH + BOS
• 将上下区域视为流动性陷阱,而非趋势进入点
• 除非结构确认,否则在新闻高峰期间减少规模
• 止损 = 波浪无效,不在波动中平均
📝 总结
黄金处于积累/再分配模式。交易台可能:
• 在4182运行买方流动性,然后向下位移 → 回测折扣
或
• 在4133扫荡卖方流动性,确认CHoCH上升 → 冲动扩展
今天是流动性交易日,而不是早期趋势追逐。仅在确认后执行。
📍 关注@Ryan_TitanTrader获取每日聪明资金更新。

黄金H1 – 流动性游戏,哈塞特领跑美联储主席竞赛🟡 XAUUSD – 日内聪明资金计划 | 作者:Ryan_TitanTrader (26/11)
📈 市场背景
黄金本周开盘对新的政治头条做出反应,凯文·哈塞特成为特朗普下任美联储主席的领跑者。
这对黄金很重要,因为:
• 倾向鹰派的美联储主席人选通常会加强美元并对黄金施压。
• 市场可能会计入更紧缩的政策预期,增加短期看跌压力。
• 官方宣布前的政治波动通常会引发双向流动性抓取。
随着市场情绪转向更强的美元,黄金在关键溢价和折扣区间周围处于经典SMC风格的扫荡位置。
🔎 技术分析 (1H – 聪明资金结构)
• 市场结构
价格已触及一个小的溢价区,并显示出早期拒绝迹象。
下方,4140–4138区域与日内需求和最近位移的起源一致。
• 溢价卖出区 (1H 供应)
4210 – 4212
• 位于当前买方流动性之上
• 相对于日内结构的明显溢价
• 在任何下行位移前的高概率扫荡区
• SL区域:4220流动性口袋
• 折扣买入区 (1H 需求)
4140 – 4138
• 之前的CHoCH起源
• 与折扣回撤一致
• 与未缓解的内部需求块汇合
• SL区域:4130卖方流动性
• 流动性地图
• 买方:4212 → 4220
• 卖方:4138 → 4130
预计典型的SMC序列:
扫荡 → CHoCH → 位移 → 回测 → 扩展。
🔴 卖出设置 – 溢价反应
入场:4210 – 4212
止损:4220
止盈:
→ 4160(反应水平)
→ 4145(中间流动性)
→ 4140–4138(折扣区回测)
📌 仅在流动性扫荡 + M5–M15看跌CHoCH后激活。
🟢 买入设置 – 折扣反应
入场:4140 – 4138
止损:4130
止盈:
→ 4160(日内反应)
→ 4185(溢价边缘)
→ 4210(流动性扫荡目标)
📌 仅在卖方扫荡 + 看涨CHoCH后有效。
⚠️ 风险管理注意事项
• 围绕美联储主席提名的头条可能会导致美元突然走强——等待结构变化。
• 避免在4150–4180的震荡区内交易,除非有明确的位移。
• 将今天视为流动性驱动的交易日,而非方向性趋势日。
📝 总结
随着市场消化凯文·哈塞特领跑美联储主席竞赛的消息,黄金在溢价和折扣区间之间轮动,这一发展可能会倾向于更坚定的政策预期。
机构玩家可能会在4210以上或4140以下寻找流动性,然后再决定方向。
今日关键水平 (26/11)
🔴 卖出区:4210–4212
🟢 买入区:4140–4138
准备:
积累 → 扫荡 → 位移 → 回测 → 目标。
📍 关注 @Ryan_TitanTrader 获取每日聪明资金更新。

黃金等待PPI和GDP數據 – 逢低買入,逢高賣出🟡 XAU/USD – PPI和GDP數據將定義區間擴展
🔍 市場背景
黃金仍在$4000–$4100之間震盪,經過上週的流動性掃蕩後進行整固。
本週的美國關鍵數據——核心PPI、零售銷售、GDP和核心PCE——可能決定下一個重大走勢。
通脹和消費數據的輕微改善可能會暫時加強美元,但由於預期美聯儲將在第一季度保持鴿派立場,中期整體偏向看漲。
📊 技術展望(4小時圖)
主要賣出區(超級OB):4170–4200 → 潛在的反轉供應區。
公平價值缺口(FVG):4130–4160 → 如果價格回撤,短期反應區。
賣出區:4090–4095 → 與日內看跌結構一致的短期機會。
買入區1:4024–4025 → 輕微需求,預期內部流動性掃蕩。
買入區2(主要OB):4003–4001 → 強大的訂單區塊,多次拒絕;關鍵流動性池。
結構:H4 BOS(看漲)保持完好,暗示在下一次向上擴展前進行流動性掃蕩。
🎯 交易計劃
1️⃣ 賣出設置 – 短期從FVG反應
進場:4090–4095
止損:4100
獲利1:4055
獲利2:4040
獲利3:4025
➡️ 理由:價格可能觸及FVG的下緣並掃蕩本地流動性,然後向內部區間需求下行反應。
2️⃣ 買入設置 – 首次需求區測試
進場:4024–4025
止損:4022
獲利1:4065
獲利2:4080
➡️ 理由:預期在中間區間下方進行短期流動性抓取,然後繼續看漲。
3️⃣ 買入設置 – 主要OB累積區
進場:4003–4001
止損:3998
獲利1:4045
獲利2:4075
獲利3:4090
➡️ 理由:深度流動性區與高時間框架OB對齊。如果宏觀數據令人失望,該區域可能觸發下一個衝動腿以重新測試4170+。
🧭 整體偏向
→ 在核心PCE之前的震盪偏向
→ 在4000–4100區間內逢低買入 – 逢高賣出,直到GDP/PCE數據後出現明確突破。
→ 注意FVG周圍的假突破,並在美國會議發布前保持風險控制。

黄金H1 – 非农前流动性狩猎,美中关系升温🟡 XAUUSD – 日内聪明资金计划 | 作者:Ryan_TitanTrader (25/11)
📈 市场背景
黄金正接近一个关键的溢价区,市场对新的地缘政治头条做出反应。今天早些时候,唐纳德·特朗普确认他与中国国家主席习近平进行了“非常好的通话”,强调了强有力的双边关系和持续的合作。
这对黄金很重要,因为:
• 美中关系升温通常会降低地缘政治风险溢价,给黄金带来压力。
• 时间点至关重要:市场正进入非农周,这是机构经常进行流动性抓取的时期。
• 交易者可能会在非农前看到一个支持美元的环境,特别是如果风险情绪稳定。
简而言之,黄金正处于一个流动性扫荡高度可能发生的区域,随后可能会出现更大的走势。
🔎 技术分析 (1H – SMC结构)
• 市场结构
价格正在攀升至4170–4172附近的一个主要流动性集群,与之前的等高点和未缓解的供应区块一致。
下方,4102–4100的FVG需求区是今天的折扣反应区。
• 溢价卖出区 (1H供应)
4170 – 4172
• 买方流动性位于之前高点之上
• 相对于当前摆动结构的明显溢价区
• 非农波动前设计扫荡的可能目标
• 折扣买入区 (1H需求)
4102 – 4100
• FVG不平衡 + BOS起源
• 与折扣回撤水平的汇合
• 卖方扫荡后看涨反应的强RR
• 流动性地图
• 买方:4172 → 4180
• 卖方:4100 → 4092
期待经典的SMC序列:
扫荡 → CHoCH → 位移 → 回测 → 扩展。
🔴 卖出设置 – 溢价反应
入场:4170 – 4172
止损:4180
止盈:
→ 4138(不平衡填补)
→ 4115(中间流动性)
→ 4102–4100(折扣区回测)
📌 必须等待流动性扫荡 + M5–M15上的看跌CHoCH。
🟢 买入设置 – 折扣反应
入场:4102 – 4100
止损:4092
止盈:
→ 4135(日内反应)
→ 4160(溢价边缘)
→ 4170(买方流动性扫荡)
📌 仅在卖方流动性被拿走后有效。
⚠️ 风险管理注意事项
• 预计市场在非农前因美中乐观情绪而波动加剧。
• 亚洲/伦敦时段常见流动性陷阱——等待确认。
• 避免在4125–4150的震荡区内没有结构变化的情况下建仓。
• 将两种情况视为流动性操作,而非趋势延续交易。
📝 总结
随着特朗普与习近平的积极通话后地缘政治情绪改善,黄金正接近一个主要流动性口袋。
随着非农临近,机构可能会在4170以上或4100以下扫荡流动性,然后确定方向。
今日关键水平
🔴 卖出区:4170–4172
🟢 买入区:4102–4100
准备迎接典型的非农前模式:
积累 → 扫荡 → 位移 → 回测 → 目标。
📍 关注@Ryan_TitanTrader获取每日聪明资金更新。

黄金H1 – 经济放缓会引发流动性清扫吗?🟡 XAUUSD – 日内聪明资金计划 | 作者:Ryan_TitanTrader (24/11)
📈 市场背景
黄金继续在一个紧密的压缩区间内移动,而市场对美国分析师提出的新经济担忧做出反应。
根据今天的报告,经济学家越来越担心消费者行为中出现的异常放缓模式——支出仍然很高,但信心和储蓄正在减弱。
这种混合的宏观图景带来了不确定性:
🔹 今天新闻的关键要点:
• 美国消费者仍在消费,但信心正在恶化,这是对未来增长的一个警示信号。
• 经济学家警告这种分歧可能导致未来几个季度经济动能减缓。
• 信心减弱 → 衰退恐惧增加 → 通常在流动性清扫后对黄金有支持作用。
• 然而,短期波动性仍然很高,因为市场重新评估美国需求的可持续性。
随着不确定性上升,机构可能会在做出方向性移动之前进行双向流动性抓取。
黄金目前在4015–4100之间旋转,遵循一个清晰的SMC区间结构。
🔎 技术分析 (1H / SMC结构)
• 市场结构
价格正在形成一个下降的压缩模式,伴随着重复的CHoCH信号,表明两侧的流动性被设计。
• 高价卖出区 (1H供应)
4100 – 4102
→ 上方休眠的买方流动性
→ 与未缓解的内部供应+趋势线流动性一致
• 低价买入区 (1H需求)
4015 – 4013
→ 在先前的清扫区内
→ 与上升结构+BOS起源汇合
• 流动性地图
• 买方流动性:高于4102 – 4110
• 卖方流动性:低于4013 – 4008
在真正的位移之前,可能会清扫任一口袋。
🔴 卖出设置 (高价反应区)
入场:4100 – 4102
止损:4110
获利目标:
→ 4065 (不平衡填补)
→ 4040 (区间中点)
→ 4018–4015 (低价重测)
📌 执行规则:等待流动性清扫进入区域+M5–M15上的看跌CHoCH。
🟢 买入设置 (低价反应区)
入场:4015 – 4013
止损:4008
获利目标:
→ 4055 (短期反应)
→ 4080 (高价边缘)
→ 4100 (清扫目标)
📌 仅在价格首先获取卖方流动性并从低价显示看涨位移时有效。
⚠️ 风险管理注意事项
• 市场可能对美国消费者信心减弱做出不可预测的反应——在波动期间减少风险。
• 除非形成清晰的突破或CHoCH,否则避免在4040–4070的震荡区间内交易。
• 将两种设置视为基于流动性的操作,而不是趋势延续交易。
• 预计在伦敦扩张前的亚洲时段会有设计的操控。
📝 总结
随着经济信号转为混合,黄金仍被困在一个受控的SMC区间内。
随着经济学家对消费者信心分歧提出担忧,黄金今天可能经历突破前的流动性清扫。
关键区域:
🔴 卖出区:4100–4102
🟢 买入区:4015–4013
期待经典的SMC序列:
积累 → 清扫 → 位移 → 重测 → 目标。
📍 关注@Ryan_TitanTrader获取更多聪明资金更新。

黄金H1 – 这是一个区间还是即将突破?🟡 XAUUSD – 日内聪明资金计划 | 作者:Ryan_TitanTrader (21/11)
📈 市场背景
黄金继续在一个压缩的日内区间内交易,市场对美联储是否会很快降息的最新讨论做出反应。
根据新的报告,政策制定者保持谨慎,随着通胀进展放缓,早期降息预期正在消退。
这种转变推动美元走强,提高国债收益率,并暂时削弱黄金的看涨势头。
新闻的关键要点:
• 美联储官员指出,通胀“仍未达到需要的水平”,降低了早期降息的可能性。
• 市场已缩减对第一季度降息的预期,支持美元。
• 更高的收益率 → 更紧的金融条件 → 黄金难以突破溢价水平。
• 机构可能在承诺新的方向性移动之前,在两侧进行流动性抓取。
价格目前位于4030–4045区域附近,正好在折扣流动性之上,等待一个催化剂突破短期压缩。
🔎 技术分析 (1H / SMC结构)
• 市场结构:
黄金已完成一个明确的CHoCH + 短期看跌序列,现在压缩到4030附近的折扣区。
• 溢价卖出区 (4H供应):
4128–4130与未缓解的供应+买方流动性在内部高点之上对齐。
• 折扣买入区:
4030–4028位于上次清洁需求区内,之前发生过扫荡。
• 流动性地图:
→ 买方流动性:在4128–4135之上
→ 卖方流动性:在4028–4020之下
机构可能在提供方向之前扫荡一侧。
🔴 卖出设置 (溢价反应区)
• 入场:4128 – 4130
• 止损:4140
• 止盈:
→ 4080 (小失衡填补)
→ 4045 (区间EQ)
→ 4030–4028 (折扣需求重测)
📌 执行规则:等待流动性扫入区域+M5–M15上的看跌CHoCH后再入场。
🟢 买入设置 (折扣反应区)
• 入场:4030 – 4028
• 止损:4020
• 止盈:
→ 4060 (短期反应水平)
→ 4095 (效率填补)
→ 4120 (溢价重测)
📌 仅在价格扫过4030–4028口袋并显示出从折扣的看涨位移时有效。
⚠️ 风险管理注意事项
• 随着降息押注消退,美元强势可能意外飙升——在波动期间减少仓位。
• 除非形成清晰的结构突破,否则避免在4045–4085的震荡区内交易。
• 一旦流动性水平被占据,积极管理交易。
• 预计在低交易量的亚洲时段会有工程操控。
📝 总结
黄金在一个狭窄的日内区间内压缩,市场重新评估美联储降息的可能性。
SMC结构建议在决定性移动之前进行双向流动性扫荡:
• 卖出区:4128–4130 (溢价供应)
• 买入区:4030–4028 (折扣需求)
预计经典的积累 → 扫荡 → 位移模式,直到宏观条件创造新的趋势。
📍 关注@Ryan_TitanTrader获取更多聪明资金更新。
