黄金 GOLD行情大局以及趋势分析
黄⾦正接近⽤于完成⼀个“持续数周、甚⾄数⽉的主要三浪(Wave-3)顶部持续数周还是数顶部”的最⼤价格目标区。任何回落都应被视为修正走势,⽆论该修正持续数周还是数月。长期趋势与前景并未发生改变,2026年后期至2027年,价格仍然有望显著走高,最终可能远高于5,000美元。
⚠更多交易分析及工具可以关注 NeuraAlgo 进行查看!
Goldprice

黄金GOLD趋势与基本交易策略周线复合:在周线顶部被确认之前,上⾏空间应当非常有限。
日线复合:在完成日线低点之前,价格⼤概率会有 2–3 天的横盘⾄下⾏⾛势。
关键因素:黄⾦(以及白银)正接近在周线顶部完成之前所能达到的最⼤上⾏价格区间。
交易策略建议:若日线收盘跌破 4,496.1(1 月 6 日收盘价),则表明周线顶部甚⾄数月级别的顶部应已完成。
⚠ 短期交易者应以TradingBox信号系统为准!

黄金交易趋势分析与未来展望尽管黄金在短周期内的浪型计数与结构划分出现一定调整,价格走势阶段性震荡反复,但这类变化并未对黄金的长期趋势与核心逻辑造成实质性破坏。从更高时间框架(周线—月线)来看,黄金仍运行在清晰的长期上升通道之中,结构保持完好。
从宏观层面观察,全球货币体系不稳定性持续存在,高负债环境、地缘政治冲突常态化,以及去美元化趋势的逐步推进,均强化了黄金作为核心避险资产与价值储存工具的战略地位。各国央行持续增持黄金,也为中长期价格提供了坚实的底层支撑。
展望 2026–2027 年周期,黄金极有可能进入一轮更具加速特征的主升阶段。一旦完成当前中期结构整理,并在高位形成有效换手,价格有望突破既有估值区间,向更高的长期目标推进。综合趋势结构、宏观环境与历史周期推演判断,黄金价格在未来数年内显著走高的概率较大,最终不排除向 5000 美元附近演进的可能性。
整体而言,短期波动属于趋势中的正常修正,而黄金的大方向依旧清晰:
结构未坏、逻辑未变、长期仍偏多。
免责声明: 其中的信息和发布内容不构成也不代表金融、投资、交易或其他类型的建议。

黄金GOLD趋势与基本交易策略周线复合:混合,在确认周线⾼点反转为空头之前,上⾏空间应当是非常有限的。
日线复合:趋势应当还能维持3–4 天的偏多⾛势,之后才会完成⼀个日线⾼点,⽽这个日线⾼点可能与周线⾼点同步出现。(牛)
关键因素:12 月下旬的那⼀波急跌,并没有出现明显的跟随下跌(follow through)。自 12 月 31 日低点以来的上涨⾛势,看起来是⼀个推动式趋势(impulse trend),这意味着:在确认周线⾼点之前,再创新⾼的概率较⼤。
交易策略建议:“修正后”的浪型计数显示:黄⾦很可能在接下来⼀到两周内再创⼀个新⾼,随后将进⼊⼀段持续数周,甚⾄数月的回调 / 修正⾏情。
⚠ 短期交易者应以TradingBox信号系统为准!

黄金GOLD趋势与基本交易策略周线复合:混合,本周将从超买区形成空头反转,警示周线⾼点已完成。
日线复合:日线趋势应在日线低点完成前维持横盘或下跌2-3日。(熊)
关键因素:上周的急剧下跌抹去了黄⾦整整⼀个月的涨幅,使黄⾦和白银均处于⾄少已完成周线⾼点的位置。黄⾦⾄少⾄⼆月初、更可能⾄三月将保持净空头态势,尽管下⾏空间可能非常有限,可能维持在⼗月低点上⽅。
交易策略建议:将继续采取观望策略,直⾄黄⾦进⼊完成周线低点的位置,该位置不太可能于⼆月初前出现。
⚠ 短期交易者应以TradingBox信号系统为准!

黄金GOLD趋势与基本交易策略周线复合:周级别超买,周⾼点可能已经临近。
日线复合:日⾼点临近,可能与周⾼点重合。(熊)
关键因素:自10月 28 日低点 开始的上涨看起来属于修正⾏情。12 月初出现了收盘价重叠,这不符合推动浪的特征,⽽是典型的修正⾛势。尽管目前⽆论周还是日线动能都尚未进⼊转势状态,但如果这轮上涨如预期是⼀次修正,下周应当是完成这波上涨的最晚时间窗⼝。
交易策略建议:仍然选择观望策略,直到黄⾦运⾏到⼀个可以确定完成周线低点的位置,⽽这⼀情况在未来⼏周内不太可能出现。在我看来,这轮自 10 月⾼点开始、呈现为横盘震荡区间的修正完成后,⽆论是向上还是向下,都很难获得的有价值的交易机会。
⚠ 短期交易者应以TradingBox信号系统为准!

XAUUSD H1 Chengjiao liang fenbu yu guanjian jiage quyuXAUUSD H1 – 成交量分布与关键价格区域
黄金仍处于强劲的上升趋势中,主要策略仍是等待回调做多
PRIORITY SCENARIO – 主要情景
顺应主趋势的回调买入策略,结合成交量分布关键水平
预期买入区域:约 4253,对应 VAH
需关注的短期区间:4263 – 4285
价格预期:自 VAH 反弹,测试区间上沿后继续向上扩展
仓位管理:
若价格能稳守 4263 上方并出现明确的多头反应,可继续持有多头思路。
若价格在 4285 附近出现明显受阻,应降低风险,该区域为重要的短期阻力位。
ALTERNATIVE SCENARIO – 备选情景
在扩展阻力区域进行短线逆势交易的可能性
备选卖出区域:约 4310,对应斐波那契扩展位
仅在该区域出现明确价格拒绝信号时考虑
核心逻辑
H1 周期上的多头结构依然保持完整
成交量分布显示 4253 附近的 VAH 为高概率价格反应区
4310 区域为扩展阻力位,适合多头获利了结或短期回调反应
宏观背景
美联储持续降息并维持偏鸽立场,对美元形成压力并支撑黄金价格。
地缘政治紧张局势以及对美国经济放缓的担忧,进一步强化避险需求。
市场正等待即将公布的非农就业数据,疲弱数据可能推动金价继续上行,而强劲数据则可能引发短期回调。
风险管理与监控
当金价运行于 4263 – 4285 区间内时,不建议追价。
若价格明确跌破 VAH 下方支撑区域,多头情景将失效。
需警惕重要经济数据公布期间的波动放大,并严格控制风险。

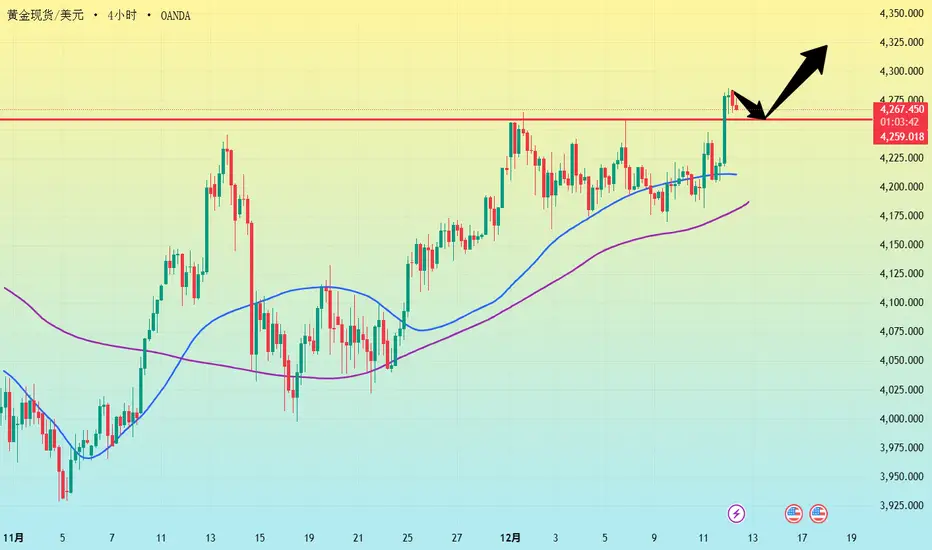
Latest gold price trend analysis today!Market News:
On Friday (December 12th) in early Asian trading, spot gold fluctuated narrowly, currently trading at $4270 per ounce. The dollar was sold off following the Fed's decision, and weak US unemployment claims data put pressure on the dollar, accelerating the rise in international gold prices. This prompted a surge in spot gold overnight, reaching a more than one-month high, with international gold rising nearly $80, reaching a high of $4285. In addition, silver hit a new historical high, which also boosted London gold prices.
With the release of non-farm payroll data and the evolution of geopolitical situations, the gold market may see more opportunities, but potential pullback risks should be noted, such as the Fed pausing interest rate cuts or an unexpectedly strong global economy. Overall, gold still has strong upward momentum, and long-term holders are advised to pay attention to tools such as ETFs to seize the wealth opportunities brought by this safe-haven wave. In addition, the speeches of Fed officials should be noted during this trading day.
Technical Analysis:
Gold's strong rally, following expectations, broke through 4280 and reached a new monthly high of 4286. The daily chart shows a large bullish candle, with the 10-day and 7-day moving averages opening upwards, and the price trading along the upper Bollinger Band. The hourly and 4-hour charts also show a bullish crossover of moving averages across different timeframes, and the Bollinger Bands are widening upwards. The trading strategy for gold remains unchanged: buy on dips during the day. From a 4-hour technical perspective, gold broke through the upper Bollinger Band resistance with a strong bullish candle, simultaneously breaching recent highs. The current price is firmly above the upper band, indicating a strong buy trend. Future analysis should focus on two key levels: the 4300 ounce level as resistance; a successful break and hold above this level could open up further upside potential. On the downside, the 4220 ounce level is crucial support, serving as the midpoint of the recent trading range and providing strong technical support.
Gold Trading Strategy:
Buy gold at 4230-4235 (short-term), stop-loss at 4220, target 4280-4300; Sell gold at 4300-4305 (short-term), stop-loss at 4320, target 4220-4200;
Key Levels:
First Support: 4255, Second Support: 4240, Third Support: 4222
First Resistance: 4290, Second Resistance: 4312, Third Resistance: 4328
XAUUSD – Brian|降息之后XAUUSD – Brian|降息之后,从成交量分布来看黄金仍偏向继续下跌
1. 市场概况(Market snapshot)
在最新一次降息决议之后,黄金虽然出现了一波反弹,但未能延续涨势,目前仍徘徊在上周高点之下。
亚盘时段,金价只是小幅上行,随后很快再次被抛压打回——这说明在当前价位,多头买盘并不算积极、动力不足。
风险偏好(risk-on)情绪回归,美元出现温和反弹,对 XAU/USD 形成一定压力。
不过,市场仍预期美联储整体维持偏鸽(dovish)基调,这在中期内可能限制美元的上行空间。
综合来看,短线 Brian 依然倾向于下跌走势为主,更偏好在上方流动性区域寻找做空机会,而不是盲目追多。
2. 成交量分布视角 – 关键价位
在 H1 图表上,Volume Profile(成交量分布)主要给出了三个关注区域:
VAL – 短线多单(Scalping Buy)区域:约 4,207
→ 当前 value area 的下沿,价格有机会在此出现技术性反弹。
流动性 / 做空区(Sell zone):约 4,222
→ 上方的一块流动性口袋(liquidity pocket),与 VAH 及成交量密集区重合——如果价格被拉升回测到这里,是一个不错的做空观察区域。
更深一层 Buy 区:约 4,166
→ 下方较宽的需求区(demand zone);如果价格在扫过上方流动性后被进一步砸低,这一带可能会出现抄底买盘。
3. 交易情景参考(Trade scenarios)
情景一 – 在 4,222 流动性区域做空(核心思路)
交易思路:
等待价格回调至 4,222 一线的流动性区,然后在 H1 / M15 上寻找明显的**反转/拒绝信号(rejection)**后再考虑进场做空。
做空区间: 4,220–4,223
建议止损: 4,230 上方
分批止盈参考:
TP1:4,207(VAL)
TP2:4,190–4,185
TP3:4,170–4,166(更深 Buy 区)
这一思路是顺应当前的空头方向(bearish bias),核心逻辑是:
“sell the rally”——在高成交量 + 高流动性区域做空回调。
情景二 – 在 VAL 4,207 与 4,166 区域轻仓做多
1)在 VAL 短线多(Scalp Buy):
入场区间:4,204–4,207
目标:反弹至 4,217–4,220 一带后离场,不做长线持有。
2)在更深 4,166 Buy 区做多(更干净的水平):
入场区间:4,164–4,168
止损:4,158 下方
目标:4,190 → 4,210
需前提是:出现较明确的看涨 K 线信号,并且美联储并未释放过度“鹰派(hawkish)”信号。
这两种多头方案都只是短期反弹思路,偏向博弈修正浪,因此仓位大小应相对保守,因为大方向仍偏空。
整体策略上:
建议耐心等待价格触及 4,222 一线后再重点考虑空单,不要在中间区域勉强进场。
简而言之:4,222 一带做空是主要计划;
而在 4,207 和 4,166 做多,只是当 Volume Profile 与价格行为(price action)给出明确信号时,才考虑的次要方案。

黄金GOLD趋势与基本交易策略周线复合:在确认周低点前,⾏情⾄少横盘或下跌1-2周。(熊)
日线复合:任何反弹都应受限,在确认日线⾼点之前不会有太⼤上⾏空间。
关键因素:从 10 月 28 日低点以来的上涨看起来是修正性质。可能是⼀段 ABC 结构。
交易策略建议:继续观望,直到黄⾦接近完成⼀个周线级别的低点。目前来看,这⾄少需要⼏周时间。若黄⾦日线收盘价突破 4365,将 否定我对未来 2-3 周看空的展望。
⚠ 短期交易者应以TradingBox信号系统为准!

黄金GOLD趋势与基本交易策略周线复合:在确认周低点前,⾏情⾄少横盘或下跌2-3周。(熊)
日线复合:未来2-3天,⼤概率会形成日⾼点。
关键因素:从 10 月 28 日低点以来的上涨看起来是修正性质。日线正逼近超买,价格仍明显低于修正完成前的最⼤应达⽔平。预计 4340-4394 区间应是修正完成前的最⼤上限。
交易策略建议:若黄⾦日线收盘价突破4394,将否定对未来 2-3 周看空的展望。
⚠ 短期交易者应以TradingBox信号系统为准!

黄金H1 – 4212会守住并跌至4160吗?🟡 XAUUSD – 日内聪明资金计划 | 作者:Ryan_TitanTrader (27/11)
📈 市场背景
黄金目前在强劲的H1位移后,交易于一个上升的机构通道内。市场正压缩进入一个流动性丰富的整合阶段——这是一个经典的聪明资金陷阱环境,随后是精心设计的扩张。
今天聪明资金桌的目标:
• 预期美元走强形成看跌偏见
• 内部区间高点上方的流动性扫荡
• 整合假突破诱导散户错误定位
• 在真正的方向性移动之前需要CHoCH/BOS确认
图表显示在溢价(卖出机会)和折扣(重新进入买入区域)处的等量流动性区域。
🔎 技术框架 – 聪明资金结构(H1)
当前状态 = 累积/再分配阶段
流动性地图高亮区域:
• 溢价流动性区域:4212 – 4214(短线陷阱目标)
• 折扣流动性起源区域:4165 – 4163(高时间框架需求重新进入)
• 平衡/震荡区域:4180 – 4195(除非位移,否则不交易)
• 趋势线支撑:~4173区域(必须突破以继续下行)
预期序列:
扫荡 → CHoCH/MSS → BOS → 位移 → 回测(FVG/OB)→ 扩张
🎯 今日交易计划
🔴 卖出黄金 4212 – 4214 | 止损 4222
论点:溢价高点的流动性扫荡后看跌位移
入场激活规则(必须等待):
• 价格触及4214流动性口袋
• M5–M15上看跌CHoCH/MSS + BOS下行
• 在BOS后于FVG填补或订单块回测时入场
目标:
1. 4200(首次反应)
2. 4187 – 4185(BOS回测区)
3. 4170(通道中平衡)
4. 4165 – 4163(H1需求回测/利润核心)
🟢 买入黄金 4165 – 4163 | 止损 4143
论点:折扣起源触及以继续冲动买入
入场激活规则(必须等待):
• 价格扫入4163池
• M5–M15上看涨CHoCH/MSS + BOS上行
• 强烈看涨拒绝影线 + FVG填补确认
目标:
1. 4185 – 4187 收复区
2. 4200+ 机构扩张目标
3. 4212+ 溢价重访
⚠️ 风险管理
• 除非位移,否则避免在4180 – 4195内交易
• 不要将扫荡解释为趋势入场——它们是陷阱
• 止损 = 结构无效,不在整合中平均
• 除非MSS确认,否则在货币头条期间减少规模
📝 总结
黄金目前处于精心设计的流动性模式。预期:
• 扫荡4214 → MSS/BOS下行 → 跌入4163折扣回测,
或
• 触及4163 → 看涨MSS/BOS上行 → 扩展至4200 – 4212+
今天 = 仅基于确认的执行,不追逐趋势。
📍 关注@Ryan_TitanTrader获取每日聪明资金更新。

黄金GOLD趋势与基本交易策略周线复合:在确认周低点前,⾏情⾄少横盘或下跌2-3周。(熊)
日线复合:复合器底部汇合,⾏情可能横盘或上涨3-4天以完成对下跌的修正。(牛)
关键因素:每日收盘价低于 4059.9 确认 转势,熊市趋势应继续下跌⾄ 10 月低点。
交易策略建议:若只要周线动能趋势仍为熊且未进⼊超卖(OS)区,保持做空为主。如果未来2-3周下跌缓慢则可能出现潜在的周低点。
⚠ 短期交易者应以TradingBox信号系统为准!

黄金策略 11/18:突破此点位黄金将进一步下跌📝 黄金交易计划 – 11月18日
1. 市场背景
价格在看跌BMS突破后围绕4030–4040波动。
主要结构:在更广泛的流动性寻求环境中进行修正性反弹。
预期:流动性扫荡 → 反应 → 方向性移动。
2. 关键交易区域(来自图表)
🔽 买入区域
主要买入区域
3982 – 3980
→ 止损:3977
强烈共振(趋势线 + OB + 支撑)。
深度买入区域
3927 – 3920(OB区域)
→ 止损低于3920
仅在价格扫过3980并继续走低时激活。
🔼 卖出区域
主要卖出区域
4056 – 4058
→ 止损:4061
强烈共振:FVG + 阻力 + 流动性扫荡区域。
卖出目标
目标1:4000
目标2:3980
目标3:3930(仅在重大新闻驱动的波动情况下)
3. 预期价格情景
情景1 – 最可能
🔹 价格重测趋势线 → 小幅反弹 → 推进至4056–4058
🔹 从该区域卖出 → 目标4000 → 3980
情景2 – 次要
🔹 价格先下跌 → 达到3982–3980
🔹 寻找看涨反应 → 买入 → 重测4040–4050
情景3 – 高波动性移动(新闻影响)
🔹 如果价格果断跌破3980 → 下跌至3927–3920
🔹 强烈买入区域 → 预期反转回到4000–4030
4. 新闻影响 – 11月18日
今天的高影响事件:
美联储发言人:沃勒、巴尔、巴尔金(晚上10:00–11:00)
→ 预计黄金将出现强烈波动。
特朗普总统讲话 – 早上6:00
美国住房开工率 – 晚上8:15
🔔 注意事项:
在重大讲话前避免大额仓位。
保持止损紧凑;黄金对美元新闻反应激烈。

黄金GOLD趋势与基本交易策略周线复合:在确认周低点前,⾏情⾄少横盘或下跌2-3周。(熊)
日线复合:在日线低点完成前趋势横盘或下跌3-4周。(熊)
关键因素:每日收盘价低于 4059.9 确认 转势,熊市趋势应继续下跌⾄ 10 月低点。
交易策略建议:若只要周线动能趋势仍为熊且未进⼊超卖(OS)区,保持做空为主。
⚠ 短期交易者应以TradingBox信号系统为准!

在新的历史高点金价之前,有多少买家陷阱?📈 黄金交易计划分析 (SMC/订单流)
🔍 当前市场背景
结构:市场表现出强劲的看涨趋势,标志着结构突破 (BOS) 和在 $4,145 价位附近的流动性清扫。
流动性:
市场在上涨后进行了“首次清扫”(初始流动性抓取),表明市场准备进行修正。
向上移动的主要流动性目标(大玩家流动性)设定在 $4,240 以上。
近期价格走势:在达到峰值和初始清扫后,价格经历了急剧下跌,形成了修正区。
🎯 提议的交易计划
该计划侧重于两个主要情景:短期卖出(SELL SCALP)和主要买入(BUY GOLD)。
1. 主要买入情景(BUY GOLD)
这是继续看涨趋势(多头)的主要情景。
入场区间:BUY GOLD 4126 - 4124。
该区域可能是一个关键的订单区块或未缓解的需求区,位于之前流动性清扫的下方,作为强支撑/位移/公平价值缺口 (FVG) 区域。
止损 (SL):SL 4120。
该止损水平保护多头头寸,位于关键入场区间下方,以避免因小幅流动性抓取而被震出。
指示的止损买家区域(约 $4,145 - $4,150)表明价格下跌可能旨在清扫先前买家的流动性,然后从 $4,124 - $4,126 区域反弹。
止盈 (TP):最终目标是流动性限制大玩家($4,240 以上)。
2. 短期卖出情景(SELL SCALP)
这是修正移动期间的短期交易机会(剥头皮)。
入场区间:SELL SCALP 4208 - 4210。
该区域可能代表供应区或急剧下跌后的看跌订单区块,隐藏的卖压存在于此。
止损 (SL):SL 4212。
这是一个非常紧的止损,位于入场区间上方。
止盈 (TP):目标是 BUY GOLD 4126 - 4124 区域(主要买入入场区间)。
⚠️ 关键考虑因素
时间线:该计划要求价格按预测情景移动(跌至买入区间然后反弹)。
确认:交易者应等待较低时间框架的结构确认(例如,角色变化 - CHoCH 或看涨 BOS)在 4126 - 4124 买入区间之前进入交易,以提高成功概率。
风险管理:使用建议的止损 (SL) 是资本保护的必要措施。

黄金GOLD趋势与基本交易策略周线复合:在确认周低点前,⾏情⾄少横盘或下跌2-3周。(熊)
日线复合:日⾼点可能在未来2-3天内出现。(牛)
关键因素:今天是一个日线时间因子,应是完成日线高点及自10月底低点以来反弹修正的最大时间窗口。
交易策略建议:周线低点在未来 2–3周内 不太可能出现。
⚠ 短期交易者应以TradingBox信号系统为准!

黄金GOLD趋势与基本交易策略周线复合:周线从超卖反转,暗示周⾼点已经完成,价会出现 横盘或下⾏ 3–4 周,直到形成周线低点。(熊)
日线复合:超波反转,日线低点已接近或已完成,但任何反弹都应被视为 周线熊市中的 3–4 天左右修正。(牛)
关键因素:黄⾦和白银目前都处于完成周线甚⾄月线⾼点的位置。
交易策略建议:若只要周线动能趋势仍为熊且未进⼊超卖(OS)区,保持做空为主。
⚠ 短期交易者应以TradingBox信号系统为准!

XAUUSD – 黄金确认短期下跌趋势后突破趋势线XAUUSD – 黄金确认短期下跌趋势后突破趋势线
🪞 1. 总体观点
🌤️ 今天早上的亚洲市场中,黄金虽然卖压不强,但已突破上升趋势线。
然而,这是显示短期趋势偏向卖方的第一个信号。
💬 目前,3996 区域是重要阻力位,价格可能会重新测试该区域然后继续下跌。
如果价格突破 4007 的 FVG,趋势可能会暂时短期回升。
💹 2. 技术分析(ICT 视角)
🔸 市场结构:趋势线突破后,结构暂时转为短期看跌。
🔸 流动性 & FVG:流动性被吸引至 3960–3940 区域,而 4007 的 FVG 是第一个障碍。
🔸 订单流:聪明资金可能会轻扫至阻力区,然后继续推动价格下行。
🎯 3. 交易参考方案
💔 主要 SELL
Entry: 3996 | SL: 4004
TP: 3985 – 3972 – 3948
💢 SELL 短线
Entry: 4007 | SL: 4014
TP: 3998 – 3978
💖 BUY 反应
Entry: 3965 | SL: 3957
TP: 3976 – 3988 – 3999
🌸 BUY 深度
Entry: 3941 | SL: 3931
TP: 3955 – 3968 – 3988 – 4012 – 4066
🔍 4. 需要注意的价格区域
✨ 4007 → FVG 阻力,短期趋势确认区
✨ 3996 → 已破趋势线的测试区
✨ 3965 – 3941 → 强支撑区,易有反转反应
💬 5. 注意事项 & 互动呼吁
⚠️ 这不是投资建议,仅为个人技术观点,基于 ICT 方法。
在决定之前,请仔细观察趋势线附近的价格反应 💭
如果觉得文章有用,请 💛 点赞 – 💬 留下评论 – 🔔 关注 LanaM2
一起每天更新黄金观点,并学习更多关于聪明资金概念 🌷✨

Gold continues to fluctuate weakly. Latest Analysis.In early Asian trading on Monday, spot gold prices opened sharply lower, gapping down nearly $50 to $4,058/oz. Over the weekend, China and the United States reached a preliminary consensus on the safe resolution of several key economic and trade issues. Market optimism regarding the international trade situation has significantly increased, dampening gold's safe-haven demand. Besides trade factors, improved geopolitical dynamics and investor profit-taking have also weakened gold's appeal. Overall, international gold prices may fluctuate and adjust in the short term, but in the long term, the Federal Reserve's easing cycle and lingering potential risks may support a rebound. Expectations of a Fed rate cut, tame inflation, and uncertainty surrounding the government shutdown provide some cushion, preventing a gold price collapse.
From a daily chart perspective, last Friday saw a small bearish star close, while today's early trading opened lower and closed higher, mirroring the previous low of $4,044, forming the initial stage of a short-term double bottom. While the MACD indicator maintains a death cross, the green momentum bar shows signs of narrowing, indicating that bearish momentum is fading. The middle Bollinger Band is near $4080. The current price has returned above the middle band and has not fallen below the key support level of the 10-day moving average ($4050). The daily bullish trend structure remains intact, and the low-open-high trend further confirms the strength of buying below.
On the 1-hour chart, the price quickly dipped to $4058 in early Asian trading, forming a bullish candlestick pattern. Subsequently, the price continued to rise along the 5-day moving average, approaching the resistance of the 20-day moving average and the middle Bollinger Band. The Bollinger Band opening is currently showing signs of widening. The MACD indicator has formed a golden cross below the zero axis, and the red momentum bar continues to expand, indicating sufficient short-term rebound momentum.
However, it is important to note that the 1-hour RSI indicator is approaching the overbought 70 level, and the price is facing pressure from the previous range above $4100. A short-term correction may be needed, which provides technical support for short-term short positions.
Trading Strategy:
Short-term gold long position at 4040-4050, stop loss at 4030, target at 4080-4100; focus on the 4100 resistance level. After a breakout, focus on the 4150 level.
Short-term gold short positions at 4140-4160, in batches, stop loss at 4170, target at 4060-4030;

黄金GOLD趋势与基本交易策略周线复合:本周周⾼点即使没有完成也非常接近。(熊)
日线复合:日线超波看跌背离,资⾦流减少,日线⾼点临近,这应与周线⾼点⼀致。
关键因素:黄⾦和白银皆以已到达极端位置,可能已经完成了周⾼点,但尚未发出熊市反转信号。
交易策略建议:若黄⾦gc期货收盘低于 4070.5(10/8 收盘价),将确认周线⾼点,理想情况下,接下来⼏天的形态和日线动量位置将提供更可靠的信号。这将是我下周关注的重点。
⚠ 短期交易者应以TradingBox信号系统为准!

Prices bottomed out and rebounded. Focus on the key level of4350Gold prices fluctuated after encountering resistance at 4270 during the Asian trading session, but ultimately broke through again in the US market, fueled by risk aversion. Gold maintains a strong short-term trend, and bullish positions remain viable even if prices fall.
The current strong rebound suggests that gold, like last week, experienced a rapid price correction followed by a strong rebound.
On the 1-hour chart, the moving averages maintain a bullish upward golden cross formation. The Bollinger Bands, after narrowing in the Asian trading session, opened upward in the US market. After a strong breakout above the 4325 resistance level, gold prices continue to strengthen in the short term, raising hopes for another upward breakout. Focus on the important short-term support level of 4320 below, and the key level of 4350 above, also the MA5 moving average. A strong breakout could lead to further price increases.
Trading Strategy:
For conservative trading, wait for a price correction near 4320 to go long, with a stop loss at 4310. Profit range: 4350-4360-4380.
Of course, for aggressive trading, enter the market around 4340 and go long. Profit points are expected around 4380.
More real-time trading strategies will be posted in the channel, so stay tuned.

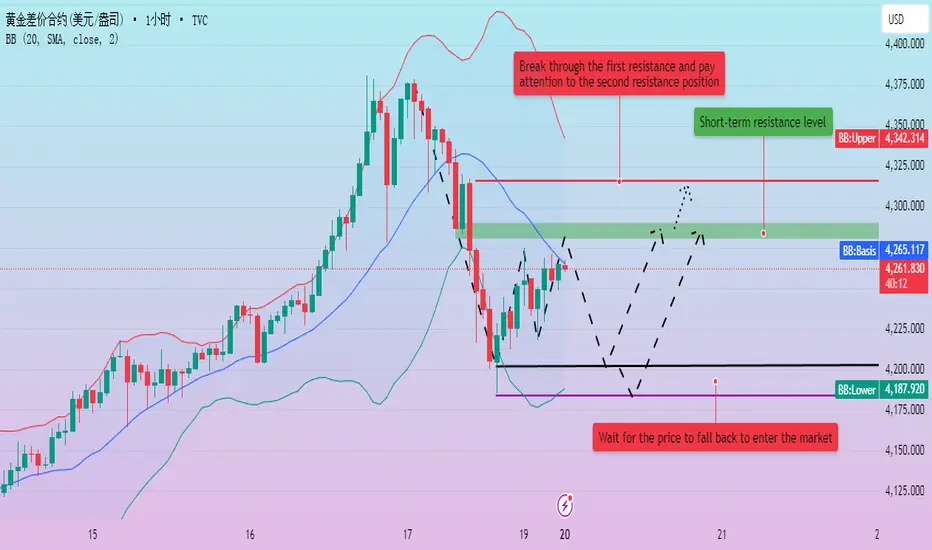
The price has corrected as expected. Waiting for an entry.The Asian market opened on Monday in perfect agreement with weekend analysis, with prices experiencing resistance at 4275 before correcting. Gold is expected to remain range-bound in the short term, with bulls poised for a correction. The Asian market opened with a continued rebound before a correction, reaching a low of 4220 as an entry point.
Short-term trading should continue within the 4220-4280 range. The recent bullish momentum showed signs of weakness last Friday. With a bullish strategy, wait for a breakout before entering the market.
Based on the 4-hour market, the immediate resistance level is currently at 4280-4290. A breakout is expected at 4315-4325. If bulls fail to achieve a sustained breakout, a period of volatile correction is imminent. Given the market volatility, Quaid recommends caution in chasing orders and patiently waiting for key entry points.
Trading Strategy:
Short with a small position when the price first reaches 4280-4290, with a stop-loss at 4305 and a profit zone at 4220.
Go long on a pullback to 4200-4205, add to your position at 4185-4295, stop loss at 4175, target at 4275-4280-4300.
Starting a new week of trading, for more real-time analysis and strategies, please follow my channel.