XAUUSD – 在美国CPI公布前,交易者获利回吐导致金价急跌5%市场背景:
黄金(XAU/USD)周二暴跌超过5.5%,创下数月来最大单日跌幅,因为交易者在即将公布的美国CPI数据(10月24日)前获利回吐。
美元指数(DXY)反弹0.36%至98.94,使得黄金对外国买家来说更加昂贵。
这一调整也与美国–中国贸易紧张局势可能缓和的乐观情绪重新燃起相吻合,此前特朗普总统确认计划下周会见中国领导人习近平。
尽管这一急剧走势让许多交易者措手不及,但似乎是更广泛看涨结构中的健康调整,因为投资者在重大数据和下周即将召开的美联储政策会议前保持谨慎。
技术展望(M30):
在从4,375高点的大幅抛售后,黄金在4,003 – 4,010附近找到短期支撑,形成潜在的积累基底。
该货币对目前交易于4,150附近,显示出早期复苏迹象,朝关键汇合区迈进。
关键技术水平:
OBS卖出区:4,338 – 4,340
CP区下/OBS卖出区:4,259 – 4,260
CP区上/OBS买入区:4,092 – 4,094
深度买入区:4,003 – 4,008
当前结构勾勒出5浪投影,价格可能在4,092附近完成浪II,然后向浪III的4,259推进,随后是修正(浪IV)和另一次向浪V的4,338推进。
交易计划:
🔹 买入区#1(短期复苏)
入场:4,092 – 4,094
止损:4,080
获利:4,145 → 4,259 → 4,338
🔹 买入区 #2(流动性扫荡情景)
入场:4,003 – 4,008
止损:3,990
获利:4,090 → 4,259
🔹 卖出区(逆趋势反应)
入场:4,259 – 4,260
止损:4,272
获利:4,145 → 4,092
总结:
最近的5%调整被视为CPI数据公布前的获利回吐阶段,而不是结构性崩溃。
预计黄金将稳定在4,092以上,买家可能在OBS买入区附近介入。
关注4,259的短期反应,以及如果动能持续,4,338作为下一个潜在流动性目标。
📊 你的看法是什么——这是CPI前的健康回撤,还是更深层次转变的开始?
👉 关注MMFLOW TRADING,获取每日机构级设置和聪明资金结构更新。
Goldtradingstrategy

“黄金持稳,静待美国关键CPI数据”黄金在亚洲早盘交易中延续其看涨势头,徘徊在$4,370附近,受到美联储降息预期和美国政府持续停摆担忧的支持,这些因素继续对美元施压。
根据CME FedWatch,市场目前预计下周再降息的概率为99%——这是黄金多头的强劲催化剂。
较低的利率降低了持有无收益资产(如黄金)的机会成本,强化了中期上升趋势。
然而,所有目光都集中在本周晚些时候即将公布的美国9月CPI报告上。
高于预期的读数可能会暂时提振美元,并引发黄金价格的短期波动。
🔍 MMFlow技术展望
黄金目前在$4,320–$4,370区间盘整,达到历史高点区域后。
价格走势显示在高点处有明显的流动性清扫,随后出现小幅回调——仍在看涨结构内。
主要趋势线保持完好,表明任何向$4,305–$4,260的下跌可能吸引新买家。
⚙️ 交易计划 (MMFlow视角)
🔼买入短线
📌入场:4,302 – 4,300 (½仓位)
❌止损:4,292
✔️止盈:4,310 → 4,315 → 4,320 → 4,330 → 4,340 → 4,350+
🔼买入区间 (波段)
✨入场:4,260 – 4,258
❌止损:4,252
✔️止盈:4,265 → 4,270 → 4,280 → 4,290 → 4,300+
📈只要价格保持在4,260以上,买入设置仍然受到青睐。
日内在4,360–4,378附近的卖出反应仅为短期——注意流动性抓取和看涨重新入场机会。
⚡️关键MMFlow区域
CP下行区/OBS卖出区:4,360
历史高点流动性卖出区:4,448
重测趋势线/OBS买入区:4,305
终结FVG上升趋势/OBS买入区:4,260
情绪:🟢看涨偏向
偏向确认:CPI数据和美联储利率预期
策略:逢低买入 → 目标流动性在4,370–4,380以上
🔥 保持耐心——让流动性驱动下一步。MMFlow追踪聪明资金区域,而非情绪。

XAUUSD PLAN | 当市场失衡时,最强的一方将留下痕迹🔍 市场背景
在短期高点设定于 4,385 – 4,372 美元 区域后,黄金进入了强劲的 技术调整 阶段,连续出现红色蜡烛并打破短期上涨结构。
卖方暂时占据优势,推动价格穿过H1上升趋势线。然而,下方支撑区域(流动性区 + 看涨订单区块)开始出现吸收力量,显示买方可能在折扣价格区域回归的可能性。
💎 技术分析
先前的上涨BoS: 确认主要趋势仍为 长期看涨 。
FVG下跌区: 4,285 – 4,260 美元 → 在下跌趋势中留下的价格平衡区,可能是价格回调以“填补缺口”前的区域。
流动性区 $$$: 4,222 – 4,218 美元 → 短期支撑区域,新买入流动性出现的地方。
看涨订单区块: 4,203 – 4,185 美元 → OB与Fibo 0.786的汇合区,大资金可能回归的地方。
深度看涨OB: 4,142 – 4,128 美元 → 主要上涨趋势的最后防线。
看跌订单区块: 4,372 – 4,385 美元 → 重要阻力区,价格回调时可能出现反应。
当前结构显示黄金处于 回撤 – 流动性再平衡 阶段,尚不足以逆转趋势的信号。
📈 交易情景
1️⃣ 主要情景 – 在流动性区域4,222 – 4,203 美元反应买入
入场:4,222 – 4,203
止损:4,185
目标:4,260 → 4,318 → 4,372
✅ 条件:在支撑区域或小型BoS逆转处出现强烈拒绝蜡烛(拒绝/看涨吞没)。
➡️ 这是“逢低买入”的设置,顺应主要趋势,利用流动性区域和OB汇合区。
2️⃣ 辅助情景 – 在FVG下跌区4,285 – 4,260 美元反应卖出
入场:4,273 – 4,276
止损:4,385
目标:4,222 → 4,203
✅ 条件:在FVG区域出现强烈下跌蜡烛或拒绝信号。
➡️ 此设置适用于在未填补的价格平衡区进行短线或短期交易的交易者。
⚠️ 风险管理
在价格未确认4,222区域时,不要FOMO买入。
如果价格跌破4,185 → 等待重新测试以继续卖出至4,128区域。
保持适度的仓位,因为市场处于再平衡阶段 – 流动性仍然混乱。
💬 结论
黄金正处于 大幅下跌后的过渡阶段 。
区域 4,222 – 4,203 美元 将是确定中期上涨趋势是否持续的关键。
如果该区域保持稳固,黄金可能会回测区域 4,318 – 4,372 美元 。
👉 合理策略:
在4,222 – 4,203 美元反应买入 ,当有确认时。
在FVG 4,260 – 4,285 美元技术性卖出 ,如果出现明显拒绝。
🔥 “当市场失衡时,最强的一方将留下痕迹 – 这次的痕迹位于4,220美元附近。”

4,200 还是 4,285?黄金的下一步决定一切📊 市场概况
黄金在本周初仍然承压,交易价格低于上周的历史高点,从4,380的急剧回调至4,240区域。
由于市场在应对不确定的美国经济数据、仍然关闭的美国政府以及多个地区的地缘政治紧张局势,这些因素共同推动了市场的恐惧和犹豫不决,投资者情绪谨慎。
在亚洲早盘时段,黄金表现出轻微复苏,但仍在一个紧密的整合区间内横盘,反映出在下一次重大走势前的不确定流动性积累。
🧠 技术结构(MMFLOW 视图)
黄金正在4,206–4,204附近的短期支撑和4,285–4,287附近的阻力之间整合。
流动性开始在当前区间的上下方聚集,暗示突破即将到来。
4,166 – 4,140区域仍然是一个主要的聪明资金重新进入区,与CP买入区+OBS需求区块一致。
在上行方面,4,313 – 4,342是一个关键供应区,之前大卖家在此介入。
在价格明确突破之前,交易者应预期日内条件波动且跟进有限。
🔑 关键关注水平
🟢 买入区(流动性重新进入区)
区域:4,206 – 4,204
止损:4,200
目标:4,210 – 4,215 – 4,220 – 4,230 – 4,240 – 4,250 – ???
🔴 卖出区(流动性反应区)
区域:4,285 – 4,287
止损:4,292
目标:4,280 – 4,275 – 4,270 – 4,260 – 4,250 – ???
⚙️ MMFLOW 场景
1️⃣ 看涨场景:
如果黄金维持在4,200 – 4,210支撑区域上方,可以预期短期反弹至4,270 – 4,285。
突破4,287将打开通往4,313 – 4,342(OBS卖出区)的空间,聪明资金可能会再次开始分配。
2️⃣ 看跌场景:
如果跌破4,200,可能会引发更深的回撤至4,166 – 4,140(CP买入区)。
这仍将代表在更广泛的看涨宏观结构内的健康调整。
⚡️ MMFLOW 洞察
市场保持中性至看涨,但当前走势反映出在压缩区间内的积累。
横盘结构表明市场正在为下一次冲动性走势加载流动性。
耐心是关键——交易者应等待明确的突破确认后再扩大仓位。
⚠️ 交易注意事项
✅ 使用紧密止损——在宏观不确定性期间,黄金的波动性仍然不可预测。
✅ 在价格停留在横盘通道内时避免过度杠杆。
✅ 专注于反应区(CP、OBS和流动性清扫)以获得精确的进入点。
🧭 快速总结
黄金在历史高点下方横盘交易。
关键支撑:4,206 – 4,204,关键阻力:4,285 – 4,287。
短期偏向:区间震荡,带有看涨基调。
最佳策略:在流动性区买入下跌;等待突破确认后进行趋势交易。

GOLD | 整体看涨,等待高点反应卖出 & 支撑回调买入🔍 市场背景
经过一系列强劲的 结构突破 (BoS) ,黄金创下 4,385美元的新高 ——标志着过去三次交易的持续上涨。
然而,这一高点目前正扮演着 重要的心理和技术阻力 角色。当价格在 4,351 – 4,385美元的流动性区域 反应时,买入力量暂时放缓。
市场正处于 流动性再平衡 阶段。
大趋势依然是上涨,但当前价格区域可能在继续扩展浪之前出现短期调整。
💎 技术分析
黄金历史高点 (ATH): 4,385美元
卖出流动性区域: 4,430 – 4,435美元 → 高流动性阻力区,可能出现短期抛售反应。
流动性区域 $$$: 4,284 – 4,282美元 → 近支撑区,与趋势线汇合。
订单区块 | 斐波那契区域: 4,226 – 4,230美元 → 深度折扣区,与0.618斐波那契汇合,具有高反转潜力。
整体结构: 仍然 看涨 ,但出现 短期弱势信号 ,价格未能维持在4,360以上。
📈 交易情境
1️⃣ 卖出设置 – 在4,385 – 4,433美元高点拒绝
Entry: 4,430 - 4,435
SL: 4,440
TP: 4,425 → 4,420 →4,415→4,410→4405
✅ 条件: 在高流动性区域出现 拒绝或强烈吞没的阴线 。
➡️ 这是流动性反应设置——当价格扫过高点并有明显抛售信号时卖出。
2️⃣ 买入设置 #1 – 在4,284 – 4,282美元区域回调
Entry: 4,284 – 4,282
SL: 4,272
TP: 4,290 → 4,300 → 4,310/Open
✅ 条件: H1蜡烛在支撑或小反转结构处强烈反应。
➡️ 顺应主要趋势买入,利用流动性支撑区域的轻微回调。
3️⃣ 买入设置 #2 – OB 深度区域 4,226 – 4,230美元
Entry: 4,226 – 4,230
SL: 4,190
TP: 4,235 → 4,240 → 4,250/Open
✅ 条件: 出现 上涨BoS或确认的看涨吞没蜡烛。
➡️ 这是深度折扣区,适合顺应主要趋势的波段交易。
⚠️ 风险管理
不要在高位 (4,360+) FOMO买入 。
优先观察4,284和4,226的价格行为后再入场。
只有在有明确确认信号时,才激活4,385–4,430的卖单。
保持适度仓位,避免在没有确认时加仓。
💬 结论
黄金在 创下4,385美元高点后积累 ,这是确定新上涨波之前调整节奏的重要阶段。
目前最有效的策略是 在4,385 – 4,430高点反应卖出 和 在4,284 – 4,226美元顺应趋势买入 ,当出现确认时。
👉 合理策略:
反应卖出: 4,385 – 4,430 → TP 4,284 – 4,226
回调买入: 4,284 – 4,282
OB 深度买入: 4,226 – 4,230

黄金重测历史高点——多头仍完全掌控📊 市场概况
黄金在亚洲时段经历了急剧的日内下跌,测试了4,280 – 4,279美元区间后迅速反弹。尽管短期波动剧烈,但黄金连续第九周以绿色收盘,确认了当前多头周期的强劲势头。
更广泛的基本面仍然支持:
💥 持续的地缘政治紧张局势使避险需求保持高位。
⚖️ 美中贸易不确定性和美国政府长期停摆的风险削弱了风险偏好。
💵 美联储降息预期和美元疲软继续利好黄金上涨。
简而言之——聪明资金仍然持有多头头寸,每次下跌看起来仍像是重新积累的流动性抓取。
🧠 技术结构 (MMFLOW视角)
在M30时间框架上,黄金继续遵循上升通道,目前在4,280 – 4,330形成流动性陷阱和突破设置。
价格走势表明,黄金可能正在完成短期调整波(B),然后恢复更大的多头冲动。
结构仍然技术性看涨,所有回调都显示出需求区的强烈拒绝。
🔑 关键水平观察
🟢 买入区 (主要设置)
区间: 4,230 – 4,228
SL: 4,220
TP: 4,240 – 4,250 – 4,260 – 4,270 – ???
🔵 CP区买入 (次要支撑)
区间: 4,284 – 4,285
SL: 4,275
TP: 4,300 – 4,315 – 4,330 – 4,340 – ???
🔴 短线卖出 (流动性反应区)
区间: 4,438 – 4,440
SL: 4,448
TP: 4,420 – 4,410 – 4,390 – ???
⚙️ MMFLOW情景
1️⃣ 主要看涨情景:
如果黄金保持在4,280 – 4,284之上,预计将继续向4,380 – 4,438(流动性卖出区)推进。
4,284水平是聪明资金可能重新进入多头头寸的关键控制点。
2️⃣ 替代修正情景:
如果跌破4,280,可能推动价格向4,249 – 4,243(CP买入区)移动,然后再进行另一次看涨推动。
这一结构仍符合更大上升趋势中的健康修正模式。
⚡️ MMFLOW见解
黄金仍处于中期扩张阶段,宏观和技术对齐都支持继续上涨。
4,280 – 4,330区间作为聪明资金的积累区,为更高的流动性扫荡做准备。
中期上涨目标:4,438 – 4,445美元/盎司(流动性卖出区)。
⚠️ 交易提示
✅ 始终使用保护性止损——流动性狩猎期间波动可能激增。
✅ 避免在高位追逐入场;等待在买入区的反应。
✅ 专注于流动性汇合区(Fibo + CP区 + 订单块)以获得最高概率的设置。
🧭 快速总结
黄金尽管早盘波动仍保持韧性。
关注4,230 – 4,228和4,284 – 4,285的买入区以可能的多头重新入场。
短期目标:4,380 – 4,438美元/盎司。
偏向:看涨——买入回调,而不是突破。

Gold Plan | 今天黄金会跌到哪里?🔍 市场背景
黄金在连续的 结构突破 (BoS) 后继续维持 短期上涨趋势 ,确认了从低位主动买入的力量。
目前价格正接近 ATH GOLD 区域,并向 流动性卖出区 4,281 美元 靠近——这是一个流动性密集的区域,可能会出现大户的短期抛售反应。
在经历了快速上涨阶段后, 技术性调整风险 开始增加。下方区域如 4,186 – 4,152 – 4,130 美元 将是机构买家在即将到来的回调中潜在的“建仓区”。
💎 技术分析
ATH GOLD: 4,275 – 4,280 美元
流动性卖出区: 4,281 – 4,285 美元 → 高流动性阻力区,可能形成短期反转反应。
流动性区 $$$: 4,186 – 4,152 美元 → 上涨趋势中的重要支撑区,预期会有技术反应。
FVG – BoS 区: 4,152 – 4,148 美元 → 尚未填补的“价格平衡区”,很可能会被再次测试。
OB 深区: 4,130 – 4,120 美元 → 与 Fibo 0.786 汇合的深度需求区,是大资金重新积累的理想区域。
整体结构仍然 看涨 ,但 处于溢价区 ——机构通常会在此区域分配订单以获取流动性,然后再进行调整。
📈 交易情景
1️⃣ 主要情景 – 在流动性区域 4,281 美元处卖出反应
当价格触及 4,275 – 4,281 美元 区域并出现明显的反转信号(拒绝蜡烛、吞没下降或小结构突破),
→ 开启 短期卖单 (scalp/intraday)。
目标: 4,186 → 4,152 美元。
止损: 超过 4,285 美元。
➡️ 这是典型的“扫流动性 – 技术反应”情景,利用高流动性峰值的短期抛售。
2️⃣ 次要情景 – 调整后按主要趋势买入
当价格调整至 4,186 – 4,152 美元 区域或更深至 OB 深区 4,130 美元 ,
并出现确认的上涨信号(强烈拒绝或小 BoS 回升),
→ 开启 顺应主要趋势的买单。
目标: 4,230 → 4,275 美元。
止损: 低于 4,120 美元。
➡️ 顺应资金流动的情景 – 等待价格调整至折扣区以顺应大趋势建仓。
⚠️ 风险管理
不要 FOMO 买入 当价格触及 4,275 – 4,281 美元区域时。
优先考虑有明确确认的短期卖出或在较低的 OB 区域买入。
在逆主要趋势交易时保持轻仓。
观察 4,186 区域的反应——这是当天的关键水平。
💬 结论
黄金正处于 上涨浪潮的高潮区 ,短期获利回吐压力可能在 4,281 美元 附近出现。
如果出现强烈反应,调整至 4,186 – 4,152 美元 区域是市场重新平衡的合理位置。
大趋势仍然 看涨 ,因此较低的 OB 区域将是 下一波合理的买入机会。
👉 合理策略:
在 4,281 美元处有反转信号时卖出反应。
在 4,186 – 4,152 – 4,130 美元处有确认信号时买入。

黄金从历史高位回落——调整幅度有限📊 市场概况
黄金从接近4,239的历史高位略有回调,显示出短期回调的早期迹象,但整体趋势仍然看涨。
尽管出现回调,基本面情绪仍支持黄金:
💬 美中贸易紧张局势和地缘政治风险继续推动对避险资产的需求。
💵 由于预计今年晚些时候美联储将降息,美元仍然承压。
⚖️ 对美国政府可能停摆的持续担忧进一步增强了黄金的吸引力。
这些因素表明,目前的下跌可能是强劲上升趋势中的健康调整,而不是逆转。
🧠 技术结构 (MMFLOW 波浪视图)
黄金可能已经在M30图表上完成了一个小的波浪(V),在4,239附近形成了新的历史高位区。
目前,价格正在展开一个修正的A–B–C模式,预计将在关键流动性区域找到支撑,然后继续上升趋势。
我们的模型突出了两个潜在的买入设置和一个短期卖出机会,适用于今天的交易时段。
🔑 关键水平
🔵 买入设置 1
区域:4,184 – 4,182
止损:4,178
目标:4,188 – 4,192 – 4,196 – 4,200 – 4,210 – 4,220 – ???
🟢 买入设置 2(更深的回调)
区域:4,148 – 4,146
止损:4,140
目标:4,152 – 4,156 – 4,160 – 4,170 – 4,180 – 4,190 – 4,200
🔴 卖出机会
区域:4,230 – 4,234
止损:4,238
目标:4,220 – 4,215 – 4,210 – 4,200 – 4,190 – ???
⚙️ MMFLOW 交易视图
📈 价格目前尊重修正波浪(A)。
我们预计可能的(B)回调将朝向4,220 – 4,230,然后(C)下跌完成于4,147 – 4,150附近(Fibo 0.618 / CP 买入区)。
从那里,聪明资金可能重新进入多头头寸,目标是向4,285卖出区的新流动性扫荡。
简而言之:
上升趋势保持不变,仅出现短期调整。
耐心是关键——最佳机会可能出现在4,150 – 4,180区间。
结构与技术共振(艾略特 + 流动性区域)和宏观情绪完美契合。
如果市场保持在4,140以上,黄金可能在接下来的几个交易日中瞄准4,285 – 4,300的新高。
然而,交易者应:
✅ 始终使用止损——在接近历史高位时波动性很高。
✅ 避免在狭窄的回调区域过度交易。
✅ 在进入之前关注关键流动性水平的反应。
⚡️ 总结
黄金技术上仍然看涨,下行调整有限。
关注价格在4,184和4,147附近的反应——这两个区域代表了聪明资金可能再次买入的强大流动性区域。
在完成此调整后,可能会出现新的冲动性上涨,达到4,285+,潜在地标志着下一个历史高位。

XAU/USD – 买方重夺结构,目标流动性区域🔍 市场背景
在昨天强劲的 流动性扫荡 之后,黄金反弹并连续形成 结构突破 (BoS) ,确认买方重新掌握控制权。
目前价格已填补 公平价值缺口 (FVG 4,191 – 4,202) ,并正朝向 卖方流动性区域 4,237 – 4,240 USD ——这是之前空头头寸的卖单和止损集中的地方。
当前结构显示 上涨动能依然强劲 ,然而从这个高流动性区域出现调整的可能性值得关注。
💎 技术分析
流动性扫荡: 完成,清除4,070底部的流动性。
FVG (公平价值缺口): 4,191 – 4,202 → 已填补,确认价格平衡。
卖方流动性区域: 4,237 – 4,240 → 潜在阻力区,可能强烈反应。
OB 区域 | 买入: 4,143 – 4,145 → 近支撑,预期价格调整时首次反应。
OB 深区 | 买入: 4,110 – 4,115 → 深需求区,与高级区 4,156 – 4,118 汇合。
整体结构: 主要趋势仍为 看涨 ,动能强劲,但需要技术性调整以重新积累。
📈 交易情景
1️⃣ 主要情景 – 卖出反应流动性区域
当价格接近 卖方流动性区域 4,237 – 4,240 USD 时,观察蜡烛图反应(拒绝,吞没下降)。
如果出现确认信号,开 短期卖单 。
目标: OB 买入区 4,145 → 4,110 USD。
止损: 高于 4,245 USD。
➡️ 这是流动性反应设置,当市场遇到与斐波那契 0.786–1.0 区域汇合的阻力时,概率较高。
2️⃣ 次要情景 – 从 OB 顺势买入
如果价格调整至 OB 区域 4,143 – 4,145 USD 并出现明显反应(强烈拒绝或小结构突破),
→ 可以开 顺势买入 。
目标: 回到 4,200 → 4,235 USD 区域。
止损: 低于 4,130 USD。
如果价格进一步下跌, OB 深买入 4,110 – 4,115 USD 将是新一轮反弹的最终“流动性吸引”区域。
⚠️ 风险管理
不要在 4,200+ 区域 FOMO 买入,因为接近流动性阻力区。
如果有明确信号,优先在 4,237 短期卖出。
当价格调整至 OB 时,等待反应再买入,不要过早抄底。
💬 结论
在完成流动性扫荡后,黄金通过多个连续的 BoS 确认 结构回升 。
目前价格接近 流动性区域 4,237 USD ——短期调整的可能性很高。
4,145 – 4,110 USD 将是买方等待反应以 积累订单并继续中期上涨的地方。
👉 合理策略:
如果有反转信号,在 4,237 USD 区域短期卖出。
在 OB 区域 4,145 – 4,110 USD 等待明确反应再买入。

XAUUSD – 避险资金持续支持黄金市场背景:
黄金连续第四个交易日吸引了强劲买盘,受到全球风险因素的混合支持:美中贸易紧张局势再度升温,地缘政治不确定性上升,以及对美国政府长期停摆的担忧加剧。
与此同时,美联储的鸽派预期使美元承压——进一步增强了黄金作为无收益避险资产的吸引力。
在亚洲交易时段,XAU/USD 创下历史新高,多头现在瞄准在全球担忧升级的情况下,可能延伸至4,200美元/盎司区域。
技术展望 (M30):
黄金继续遵循其上升通道结构,维持在4,167 – 4,154之间的动态支撑。
只要价格保持在4,139以上,整体趋势仍然看涨,下一流动性目标位于4,240 – 4,241。
需要关注的关键区域:
流动性卖出区:4,240 – 4,242
历史高点区/短期阻力:4,190 – 4,200
OBS 买入区 – CP 趋势线支撑:4,141 – 4,139
次级买入区:4,114 – 4,112
交易计划:
🔹 买入区
入场:4.141 – 4.139
止损:4.134
止盈:4.145 → 4.150 → 4.155 → 4.160 → 4.170 → 4.180
🔹 买入区
入场:4.114 – 4.112
止损:4.106
止盈:4.120 → 4.125 → 4.130 → 4.140 → 4.150
🔹 卖出区(短线反应)
入场:4.240 – 4.242
止损:4.248
止盈:4.235 → 4.230 → 4.225 → 4.220 → 4.210 → 4.200
总结:
只要价格保持在4,139区域以上,看涨的市场结构仍然完好。
关注从4,141 – 4,139的潜在长期机会,趋势线和订单区块支撑的汇合可能引发新的需求。
多头仍然掌控局面,目标是在接下来的交易中达到4,240 – 4,241流动性区域。
📊 你的看法是什么——黄金会突破4,200还是先暂停进行修正?
👉 关注MMFLOW TRADING,获取每日市场结构洞察和机构风格设置。
🟣 图表:XAUUSD M30 – 智能资金流结构,突出流动性池、CP汇合和关键买卖区域。

XAUUSD | 黄金下跌50点 M15?接下来的方向是什么🔍 市场背景
黄金价格刚刚 创下历史新高 (ATH GOLD) ,在 4,180 美元 附近,经过多次急剧上涨后。
紧接着,市场出现了 首次上涨结构破坏 (BoS) ——这表明 上涨动能正在减弱 。
目前,价格正在回到 填补公允价值缺口 (FVG) ,位于 4,125 – 4,145 美元 ,这很可能是 流动性再平衡阶段 ,在价格选择下一个方向之前。
💎 技术分析
ATH GOLD: 4,180 – 4,185 美元
公允价值缺口 (FVG): 4,125 – 4,145 美元 → 需要填补的价格空白区。
订单区买入区域 1: 4,050 – 4,060 美元 → 最近的需求区,可能形成第一个技术反应。
订单区买入区域 2: 3,980 – 3,985 美元 → 深层需求区,大流动性汇聚,有可能成为主要的“建仓点”。
整体结构: 在突破上升通道后,市场处于 技术回调阶段 ——中期结构仍然是 看涨 。
📈 交易情景
1️⃣ 短期卖出情景 – 填补FVG和技术调整
如果价格继续测试 FVG 4,125 – 4,145 美元 区域而无法突破,
→ 可以考虑 短期卖出 以迎接技术回调阶段。
目标: 第一个订单区买入区域 4,050 美元 。
止损: 超过4,155美元(避免被扫过FVG顶部)。
➡️ 此情景适合短期交易者在调整波段中交易——仅在有明确反转蜡烛确认时进入。
2️⃣ 顺势买入情景 – 从订单区反弹
如果价格调整至 4,050 – 4,060 美元区域 ,观察反应信号如 看涨吞没或强烈拒绝 。
出现确认时,开启 顺势买入 。
目标: 4,125 → 4,145 美元区域或旧高点4,180美元。
止损: 低于4,030美元。
如果第一个订单区未能守住, 3,980 – 3,985 美元 区域将是理想的长期“建仓”区域。
⚠️ 风险管理
避免在FVG未填补完成时在高价区FOMO买入。
优先在明确反应区域(OB, FVG边缘)交易。
在逆势交易时减少仓位以保护资本。
💬 结论
在急剧上涨后,黄金正在 进入价值再平衡阶段 。
当前市场结构倾向于 短期技术回调 ,然后继续主要上升趋势。
如果 4,050 – 4,060 美元 区域反应良好,黄金可能很快反弹并指向 4,150 – 4,180 美元 区域。
👉 合理策略:
在FVG区域反应时短期卖出。
在订单区买入区域有确认信号时等待买入。

XAUUSD – 创下新高后急剧回调市场背景:
黄金在创下4,179美元/盎司的新高后,出现了急剧的日内下跌,超出了早间目标4,170–4,172。
此举可能反映了在更广泛的市场谨慎情绪中获利回吐,因为美元走强,英镑大幅下跌,间接对XAUUSD施加了压力。
白银也跟随调整,下跌超过2%,在早前达到53.60后,目前交易于51美元/盎司附近。
尽管如此,整体市场情绪仍然保持防御态势——两种金属本周仍上涨约2%,这表明这是技术性回调,而不是全面的趋势逆转。
技术展望 (M30):
价格已跌破短期上升通道,目前正在重新测试关键流动性区域。
关注4,134 – 4,135区域的潜在重测(50%回调),然后继续向下买入区域。
终端流动性卖出区:4,165 – 4,170
重测区(50%下跌):4,134 – 4,135
CP买入区 / 斐波那契0.618:4,052 – 4,054
OBS买入区:4,000 – 4,005
交易计划:
🔹 卖出设置(修正玩法):
入场:4,134 – 4,136
止损:4,142
止盈:4130 - 4125 - 4120 - 4110 - 4100 - ???
🔹 买入设置(反应区):
入场1:4,052 – 4,054(斐波那契0.618汇合)
止损:4,044
止盈:4056 - 4060 - 4065 - 4070 - 4080 - 4090 - ???
总结:
黄金在创下新高后急剧下跌,标志着短期修正阶段,而更广泛的上涨趋势仍然完好。
回调至4,052甚至4,000可能会吸引买方流动性,然后再恢复。
关注4,135的潜在重测,然后继续。
📊 你的看法是什么——这只是健康的回调还是更深层次的修正开始?
👉 关注MMFLOW TRADING以获取精确的日内设置和基于结构的分析。

XAU/USD – 在流动性扫荡之后,黄金重新积累准备新的突破🔍 市场背景
今早, 黄金价格 (XAU/USD) 进行了一个非常典型的 流动性扫荡 :
价格突破旧高点 4058 ,触及 4060 , 强烈回撤 并 短期调整下跌 ——正是大资金的“流动性狩猎”。
在这次下跌之后,价格 已恢复到旧的ATH区域 (4055 – 4060) 。
这表明 短期卖方已减弱 ,而 买方正在重新占领重要结构区域 。
因此, 卖出策略不再最优 ,反之,市场正 准备进行下一轮积累 – 突破。
💎 技术分析
当前ATH: 4060 USD
旧高点: 4058 USD
今早的 流动性扫荡 已“吸干”上方流动性,为新一轮 再积累 阶段的上涨铺平道路。
区域 4048 – 4052 正扮演 重测区 的角色——如果保持稳固,这可能是突破至更高价格区域的“发射台”。
整体结构: 仍然 看涨 ,尚无中期逆转迹象。
⚙️ 重要价格区域
重测区: 4048 – 4052 → 扫荡后的支撑区,价格可能反弹。
突破区: 4065 – 4070 → 确认买方重新占据优势的区域。
扩展目标: 4090 – 4100 USD。
无效区: 低于4040 USD → 如果跌破此区域,短期上升结构将减弱。
📈 交易情景
1️⃣ Buy Continuation 情景 – 按主要趋势买入
等待价格 重测区域4048 – 4052 ,观察上涨蜡烛或确认信号(吞没,拒绝)。
当确认支撑区域时开立 买入 订单。
目标: 4065 → 4090 USD。
止损: 低于4040 USD。
➡️ 这是顺势情景,市场完成流动性扫荡并正在再积累时概率最高。
2️⃣ Buy Breakout 情景 – 确认突破时买入
如果价格 坚实突破并收于4065以上 ,这是大资金回归的信号。
在4065 – 4070附近开立 买入止损 或 限制重测突破 。
扩展目标: 4090 → 4100 USD。
止损: 低于4050 USD。
➡️ 此情景适合动量交易者,避免“假突破”风险,等待明确确认。
⚠️ 风险管理
不要在ATH区域逆势卖出 ,因为上方流动性已被吸走。
在高点区域交易时保持合理的交易量。
优先 在确认上升结构保持4050区域时买入 。
💬 结论
今早的流动性扫荡已 清除弱势订单 ,同时帮助黄金 为下一轮上涨铺平道路 。
目前,价格 正在旧高点区域4055 – 4060附近再积累 ,如果区域 4048 – 4052 继续保持稳固,黄金很可能在接下来的交易日中 突破至4090 – 4100 USD区域 。
👉 合理策略:
在支撑区域等待买入或在价格突破4065确认时买入。
目前避免逆势卖出——风险很高,因为大资金已转向积累阶段。

XAUUSD – 避险资金继续支持黄金 – MMFLOW TRADING市场背景:
黄金保持坚挺,因为美国和中国之间的贸易紧张局势再次加剧,以及地缘政治风险上升,推动避险资金流入XAUUSD。
美联储进一步降息的预期继续削弱美元,加强了金属的看涨势头。
当前展望:
只要价格走势保持在上升通道内,黄金可能会延伸至4,090–4,100流动性区域。
如果在4,092–4,095附近出现反应,可能会出现短期修正走势。
尽管短期超买信号存在,但更广泛的市场结构仍然支持看涨方向。
关键水平:
流动性买入区1:4,039 – 4,037
流动性买入区2:4,017 – 4,015
流动性卖出区:4,092 – 4,095
主要支撑:4,010 – 4,000
主要阻力:4,110 – 4,126
交易计划:
🔹 买入区 #1
入场:4,039 – 4,037
止损:4,032
止盈:4,044 → 4,048 → 4,052 → 4,056 → 4,060 → 4,070
🔹 买入区 #2
入场:4,017 – 4,015
止损:4,010
止盈:4,022 → 4,026 → 4,030 → 4,040 → 4,050 → 4,060
🔹 卖出区(短线机会)
入场:4,092 – 4,095
止损:4,100
止盈:4,090 → 4,085 → 4,080 → 4,070 → 4,060
总结:
只要4,015 – 4,020区域保持坚挺,当前结构仍然看涨。
避险需求和美联储宽松预期继续支持上涨。
注意4,092附近的潜在流动性扫荡,然后再继续走高。
📊 你的看法是什么——黄金会突破还是在4,090附近遭遇拒绝?
👉 关注MMFLOW TRADING,获取更多结构化的每日计划和专业见解。

XAUUSD – 停火与美联储评论后的突破 | MMFLOWTRADING📉 市场概览
黄金 (XAUUSD) 下跌超过2%,从 $4,012/盎司 滑落至 $3,945/盎司,隔夜急跌 $67。
此次抛售是由于两个关键因素冲击市场:
🕊 以色列-哈马斯停火协议缓解了地缘政治紧张局势。
💬 美联储的 Barr 反对10月降息,推高美元并给黄金施压。
尽管下跌,价格走势暗示这是一个暂时的修正阶段,黄金目前在短期支撑区附近企稳。
📊 技术结构 (MMFLOW 视角)
黄金确认了头肩顶 (H&S) 突破形态,颈线回测在 $4,014 – $4,033 附近作为阻力。
突破后,价格略有反弹,但仍在结构下方交易,显示空头短期内仍占据主导。
短期支撑区位于 $3,945 附近,如果跌破,可能加速下跌至 $3,912 – $3,885,与更深的流动性区域一致。
🔑 关键区域观察
阻力 (突破区): 4,014 – 4,033
支撑 (短期): 3,945 – 3,912
流动性/买入区: 3,885 – 3,878
💡 MMFLOW 交易场景
🔵 买入短线区: 3,912 – 3,910
🔴 止损: 3,905
✅ 获利: 3,916 – 3,920 – 3,925 – 3,930 – 3,940 – 3,950 – ???
交易视角:
市场仍在消化近期基本面;波动性仍然很高。
随着流动性在该需求区附近积聚,3,910 的短期反弹是可能的。
然而,除非价格重新站上 4,014,否则任何反弹可能只是修正,随后可能继续下行。
🧭 MMFLOW 洞察
尽管黄金面临看跌动能,宏观风险仍支持长期看涨叙述:
美国政府关门风险仍未解决。
如果劳动力数据疲软,美联储可能在第四季度晚些时候转向鸽派。
$3,900 以下的流动性缺口可能吸引聪明资金的积累区。
⚠️ 交易注意事项
✅ 始终设置止损 – 美联储评论后可能出现非农数据式波动。
✅ 避免追逐突破蜡烛。等待关键水平的回调入场。
✅ 要有耐心 — 最佳设置是在流动性完全吸收时形成。
📍 总结
在地缘政治缓和和美联储鹰派基调后,黄金继续承压交易。
关注 $3,910 – $3,945 附近的价格走势;该范围可能定义下一个主要冲动。
保持警惕 — 一旦流动性清除,MMFlow 将观察来自关键 OB/CP 区域的聪明资金重新入场信号。

XAUUSD | 趋势持续上涨,黄金受益于美联储及ETF资金流入 | MMFLOW TRADING📊 市场背景
黄金在美国政治和经济不稳定的背景下继续保持上涨趋势。美国政府进入关闭的第二周,尚未达成协议,这加剧了对经济表现影响的担忧。
与此同时,美联储自9月开始进入货币宽松周期,预计将在10月和12月继续降息25个基点,这正在推动黄金的强劲买盘。
不仅投资者,全球各国央行也在继续积累黄金,增加了15吨储备,显示出逐渐远离美国国债的趋势。
所有这些因素结合在一起,继续巩固可持续的上涨趋势,为战略性BUY机会打开了大门。
🔎 技术分析 (H1/H4)
价格维持在上升通道中,持续在支撑区域进行重测并反弹。
Buy Scalp Zone 4004–4002:短期快速反应区域。
Buy Zone 主区 3986–3984:重要支撑,结合FVG。
目标阻力:4068–4082 (Liquidity Zone)。
📈 交易计划
✅ BUY SCALP: 4004–4002
SL: 3996
TP: 4008 - 4012 - 4016 - 4020 - 4030 - 4040 - ????
✅ BUY ZONE: 3986–3984
SL: 3980
TP: 3990 - 3995 - 4000 - 4010 - 4020 - 4030 - 4040 - ????
⚠️ 风险管理注意事项
4000区域是心理阻力位 – 容易出现流动性清扫。
优先等待在BUY区域的明确价格行为信号。
合理调整仓位,因为政治新闻和美联储的影响可能导致波动加剧。
✅ 总结
黄金的上涨趋势因政治不稳定、美联储宽松、ETF创纪录资金流入及央行继续购入黄金而稳固。策略优先BUY在4004–4002和3986–3984,目标指向4068–4082。

多头在鲍威尔讲话前捍卫$4,000黄金在从其创纪录高点$4,059的近期下跌后依然坚挺,买家继续捍卫$4,000的心理支撑区。市场的注意力现在转向美联储主席杰罗姆·鲍威尔即将发表的讲话,这可能在下一个交易日引发强烈波动。
尽管出现调整,但在FiboMatrix框架下,结构仍然在技术上看涨——价格正在关键回撤水平内整合,为下一次扩张波准备。
📊 FiboMatrix技术结构 (M30)
支撑区 – 重测区域:
4010 – 4012 → 关键趋势线重测 + Fibo 0.618反应区,潜在的多头重新入场区域。
反应买入区:
402x → 观察确认反弹以重新加入上升趋势。
阻力区 (历史高点):
4060 → 日内天花板和枢纽点,在测试408x以上的更高流动性之前。
卖出反应区:
4084 – 4086 → Fibo 1.5 – 1.618扩展区,适合短期拒绝或短线交易。
🎯 交易计划 (Francis Setup)
✅ 买入设置:
入场:4010 – 402x
目标:4060 → 4084
止损:低于3996
⚠️ 卖出设置 (短期短线):
入场:4084 – 4086 (如果形成拒绝)
目标:4040 → 4020
止损:高于4096
🔑 Francis展望
黄金的回撤在Fibo结构内看起来健康且受控——不是崩溃。
只要价格保持在$4,000区以上,看涨情绪占主导。
👉 预期较慢的动量和可能的区间交易,直到鲍威尔的讲话。
👉 确认突破4060 – 4086可能会将涨势延伸至$4,100+及以上。
🚀 偏向:仍然看涨,保持在4010以上——“逢低买入,卖出Fibo反应。”

黄金等待鲍威尔讲话:卖出$4052还是买入$3977?大家好,TradingView社区的朋友们!
黄金市场正进入一个关键阶段。在经历了令人印象深刻的上涨之后,价格在一个重要的阻力区域停滞不前,市场情绪屏息以待今晚的主要事件:美联储主席杰罗姆·鲍威尔的讲话。
这是一个几句话就能决定整个趋势走向的时刻。让我们一起制定详细的行动计划。
1. 宏观背景:焦点在杰罗姆·鲍威尔
“余震”来自FOMC会议纪要:市场仍在“消化”昨天公布的FOMC会议纪要。纪要显示出比预期更“鹰派”的语气,因为许多成员仍然担心通货膨胀。这给黄金价格带来了轻微的压力。
主要事件:美联储主席鲍威尔讲话。
这是所有目光聚焦的时刻。交易者将“细读”鲍威尔的每一句话,以寻找未来利率路径的线索。
如果鲍威尔继续保持鹰派语气,强调抗击通胀的战斗尚未结束,美元将走强,黄金可能会进行深度调整。
相反,如果他发表“鸽派”言论,表现出对经济增长的担忧,这将是黄金突破的“绿灯”信号。
2. 技术分析:行动计划
我们的图表清晰地标出了重要的“战线”:
主要阻力区(Bearish OB - Zone):
这是卖方的“堡垒”,是获利了结和卖空压力集中的地方。在宏观背景略显鹰派的情况下,这是一个非常强的阻力区。图表上预测的情景显示价格可能回升到该区域并被拒绝。这是需要仔细观察以寻找卖出信号的区域。
主要买入区(Bullish OB - Buy Zone):
这是多头最安全和理想的“据点”。它是之前强劲上涨浪潮的订单块。一个完美的情景是鲍威尔的讲话将价格调整到该区域,创造一个以良好价格买入以跟随主要趋势的机会。
突破目标(Liquidity):
如果鲍威尔意外表现出“鸽派”,黄金可能会突破$4,052的阻力区域,直指旧高点的流动性目标。
交易策略
讲话前(19:30):市场可能会出现难以预测的波动。最好是站在场外观察,以避免价格的“扫荡”。
优先策略:基于图表上绘制的调整情景,耐心等待在强支撑区域的买入机会会更安全。
具体计划:
卖方(风险):在$4,052区域内或讲话后寻找明确的反转信号。
买方(安全):等待价格下跌到$3,977区域并寻找确认的买入信号。
你的计划是什么?
大家预测今晚鲍威尔主席会“鹰派”还是“鸽派”?你的计划是卖出$4,052还是等待买入$3,977?
👇 请在评论部分分享你的意见,并别忘了点赞👍和关注频道哦!

XAUUSD – 多头在健康回调后重新加载 | 下一个目标:4090+ 即将到来 | MMFLOW TRADING📊 市场背景
在一波强劲的上涨行情将黄金推至历史高点后,XAUUSD在周四回调约1%,因交易者从近期的上涨中获利。然而,这一走势似乎是技术性调整,而非趋势逆转——因为指标显示超买状态已持续了多个交易日。
尽管短期内有所回调,但长期上涨趋势依然完好无损。
黄金年初至今上涨超过50%,驱动因素包括:
🌍 持续的地缘政治和贸易紧张局势,
💰 美联储的货币宽松周期,
🏦 创纪录的央行黄金积累,
⚔️ 全球不确定性上升,推动了强劲的避险需求。
总体而言,这次回调可能是买入重新入场的理想设置,因为多头希望重新加载头寸,目标是4090–4100流动性区域。
🔎 技术分析 (H1/H4)
价格仍在中期看涨通道内,显示出在4000–3980支撑附近的强烈反应。
4010–4008作为短期入场的快速剥头皮区域。
3984–3982作为关键结构支撑和流动性反应区域。
4090–4092(流动性卖出区)是主要阻力——潜在的流动性陷阱区域。
📈 交易计划
✅ 买入剥头皮:4010–4008
止损:4002
止盈:4015 - 4020 - 4030 - 4040 - 4050 - ????
✅ 买入区域:3984–3982
止损:3978
止盈:3990 - 3995 - 4000 - 4005 - 4010 - 4020 - ????
✅ 卖出区域:4090–4092
止损:4098
止盈:4085 - 4080 - 4070 - 4060 - 4050 - ????
⚠️ 风险管理提示
4000水平仍是强劲的心理和结构支撑——仅在确认的价格行动信号下进入多头头寸。
在4090–4100附近要小心,那里可能出现流动性扫荡和虚假突破。
在高影响新闻或地缘政治更新期间,适当调整头寸规模以管理波动性。
✅ 总结
黄金正在其更广泛的上升趋势中经历健康的修正阶段。
策略仍然以4010–4008和3984–3982为买入重点,
上行目标指向4060–4090,
如果出现拒绝信号,4090–4092附近可能有短期卖出机会。
💡 MMFLOW TRADING – 以市场结构交易,跟随流动性,驾驭BIGWIN设置!

XAU/USD: 瞄准$4,100!FOMC会议纪要前的买入策略在哪里?您好,TradingView社区!🚀
黄金(XAU/USD)继续展现出惊人的力量,不断突破旧高点并形成稳固的上升通道。这一强劲的涨势不仅在技术面得到巩固,还在等待今天重要基本面消息的潜在催化剂。
在本次分析中,我们将结合两个重要视角:深入分析技术图表以确定最佳入场点,并审视可能显著影响美盘黄金价格的关键基本事件。
1. 基本面视角:所有目光聚焦FOMC会议纪要
今天市场的主要事件,周三,10月8日,是在东部时间下午2:00公布的FOMC会议纪要。
为什么这很重要?这份纪要提供了美联储(FED)最近一次政策会议的详细记录。交易者将仔细分析文本,寻找任何关于未来利率路径的线索。
潜在情景:
"鸽派"语调:如果纪要显示美联储官员对经济增长感到担忧,并开放进一步降息的可能性,美元可能会走弱。这将为黄金(XAU/USD)提供强劲的推动力,可能推动下一波涨势。
"鹰派"语调:如果纪要强调通胀仍然是一个担忧,美联储不急于降息,美元可能短期反弹,使黄金出现下调。
这一事件是引发波动的主要催化剂。我们的策略是准备好技术区域以利用市场反应。
2. 技术分析:详细交易计划
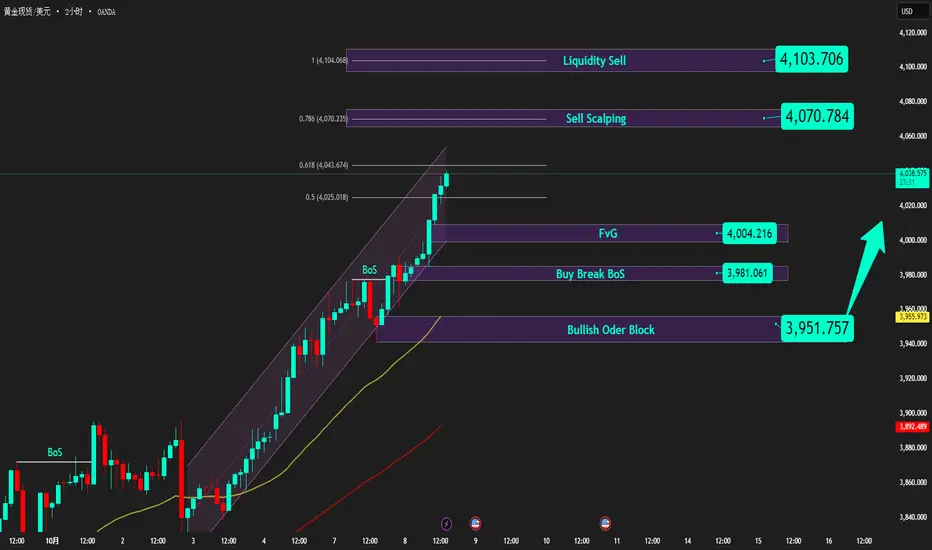
在2小时时间框架上的上升结构是不可否认的。价格正在创造一系列更高的高点,每次"BoS"(结构突破)确认买方完全掌控。以下是需要关注的重要区域:
潜在买入区域(值得注意的点):
FVG区域($4,004):最近的支撑区域是这个合理价值缺口(Fair Value Gap),市场通常会寻求填补的价格不平衡区域。价格可能在新闻发布前或期间测试该区域。
"Buy Break BoS"区域($3,981):这是最近被突破的摆动高点。现在它已从阻力转变为重要支撑水平。如果价格稍微深度调整,这个区域提供了一个稳固的入场点。
"Bullish Order Block"区域($3,951):这是买方的最后一个"堡垒"——一个强劲的买入订单块,启动了最近的推动波。这是一个理想的区域,以寻找买入订单,如果市场有一个强烈的下行流动性扫荡。
上涨目标:
短期目标(剥头皮):$4,070 - 该水平与0.786的斐波那契水平重合。
主要目标:"Liquidity Sell"区域在$4,103。这是一个大的"流动性池",卖方止损订单可能集中。聪明的资金通常会将价格推向这样的区域。
策略总结
主要趋势:上涨(Bullish)。
核心策略:在已标明的重要支撑区域寻找"逢低买入"(Buy the dip)的机会。
关键时刻:需在FOMC会议纪要公布(18:00 UTC)时保持谨慎。波动可能很大,市场可能会双向波动以扫除止损,然后才跟随主要方向。
专业提示:耐心是关键。等待价格回到已确认的支撑区域,将提供比追逐市场高点更好的风险/回报比。
你的观点是什么?
你认为黄金今天会如何反应FOMC会议纪要?你打算在哪里寻找买入机会——是在FVG区域$4,004,BoS水平$3,981,还是你在耐心等待$3,951的订单块?
请在下方评论区分享你的观点!
👇 别忘了点赞👍并关注频道以获取最新的XAU/USD分析!
XAUUSD – 日内交易计划:黄金接近4000美元,BofA警告中期调整 | MMFLOW TRADING📊 市场背景
黄金价格正逼近4000美元/盎司,但美国银行的新警告让市场变得谨慎。策略师Paul Ciana认为,黄金价格已高于MA200的20%——这一水平曾在历史高峰周期(2008, 2011, 2020, 2022)前出现过大幅调整。
然而,来自高盛、瑞银甚至美国银行的中期预测仍认为,黄金可能在明年触及4200–4900美元/盎司。这意味着长期上涨趋势尚未消失——但当前阶段容易出现意外调整,以消除FOMO买盘。
🔎 技术分析 (H1/H4)
价格正在接近历史高点区间和3990–4000的重要流动性区域。
买入区间:3935–3933(CP区间和FVG反应)提供建仓机会。
卖出区间:3993–3995(流动性区)——当价格接近4000时容易出现流动性陷阱。
🔑 关键水平
买入区间:3935–3933,主要支撑位3910。
卖出区间:3993–3995,密切观察流动性。
心理阻力位:4000。
📈 交易情景与计划
✅ 买入区间1:3935–3933
止损:3927
止盈:3940 - 3945 - 3950 - 3960 - 3970 - 3980 - ???
✅ 卖出区间:3993–3995
止损:4000
止盈:3988 - 3984 - 3980 - 3970 - 3960 - ???
⚠️ 风险管理注意事项
3990–4000区域流动性极强——在反转前容易出现顶部扫荡。
仅在有明确价格行为确认时入场,避免在价格接近心理关口时FOMO。
合理调整仓位,因为市场在讨论“中期调整”风险时波动可能高于正常水平。

可持续的价格上涨结构,下一波推动的最佳入场点在哪里?大家好,TradingView社区的朋友们!🚀
黄金 (XAU/USD) 正处于一个极其稳固的上涨结构中。与其进行冗长的分析,我们不如直接进入行动计划:哪里是最佳入场点,黄金的目标是什么?请查看下面的详细信息。
1. 市场结构分析:多头的力量 🐂
查看图表,首先映入眼帘的是一系列“BoS”(结构突破 - Break of Structure)。
每当金价突破一个旧高点时,它不仅创造了一个更高的高点(Higher High),还确认了上涨趋势的强劲和持久。这表明买方力量完全占据主导地位,并没有减弱的迹象。聪明资金(Smart Money)正在不断推高价格,我们的任务就是顺应这“波浪”。
2. 潜在买入区域 - 哪里迎接波浪?🧐
为了优化利润并降低风险,在价格调整后寻找一个理想的入场点极为重要。根据图表,我们有两个值得注意的潜在买入区域:
买入区域 1 - 斐波那契汇合 ($3885):这是一个极为理想的“买入区”,与斐波那契0.618黄金比例重合。在技术分析中,这是一个非常强的支撑位,价格通常在此反转并继续主要趋势。专业交易者总是追逐回调到该区域的机会。
买入区域 2 - FVG开发 ($3914 - $3933):稍高一点,我们有$3914的FVG(公平价值缺口)区域和$3933的“买入剥头皮”区域。这些是由于供需失衡而产生的“价格空隙”,当价格上涨过快时形成。市场倾向于回填这些空隙,然后继续其旅程。这可能是想要更早抓住波浪的朋友们的机会。
3. 征服目标 - 黄金的下一个目的地?🎯
当我们已经有了买入头寸,目标会是什么呢?
短期目标:围绕$3969的“卖出剥头皮FVG”区域可能是一个小阻力位,一些交易者会在此获利了结。
主要目标:该结构的最终目标是$3998的“卖出黄金流动性”区域。这是一个重要的“流动性”区域,聚集了大量卖方的止损单(stop-loss)。价格通常被吸引到这些区域,如同“磁铁”一样,以扫清流动性,然后再采取进一步行动。
总结与建议
主要趋势:上涨。
主要策略:当价格调整到重要支撑区域时,等待买入(Buy on dip)。
潜在买入区域:$3885(斐波那契)和$3914 - $3933(FVG)。
价格目标:$3969(短期)和$3998(主要目标)。
请始终记住,风险管理是市场生存的关键。为您的每笔交易设置合理的止损。
您对这个计划有什么看法?
黄金会回调到斐波那契$3885区域,还是会在FVG $3914区域立即反应?请在下面的评论部分留下您的意见和看法。我们将一起讨论,以寻找最佳机会!
👇 别忘了点赞 👍 并关注我的TradingView频道,以免错过每日黄金分析!

XAUUSD – 黄金突破3,900美元:避险资产崛起,美联储“助燃”涨势 | MMFLOW TRADING📊 市场背景
黄金继续彰显其力量,突破3,900美元心理关口,成为金融和政治动荡中的核心资产。
美国政府停摆 → 防御性资金强劲流入黄金。
预计美联储将降息0.25个百分点 → 进一步巩固了不支付利息的贵金属的优势。
经济数据短缺 → 投资者紧盯私人报告,增加不确定性并支持黄金保持“头号避险渠道”的角色。
👉 市场情绪完美结合:美元承压,资金撤出风险资产,买方FOMO继续放大 → 黄金面临攀升至3950–3990区域的机会。
🔎 技术分析 (H1/H4)
主要趋势:强劲上升趋势,价格保持在上升趋势线上。
买入区1: 3904–3902 → 成交量集中区,支持动能。
买入区2: 3885–3883 → 重测旧高点,为下一轮上涨积累。
卖出区: 3949–3950 → 流动性区,容易出现流动性陷阱。
扩展目标: 3994 (Fib 3.618)。
🔑 关键水平
买入区: 3904–3902, 3885–3883
卖出区: 3949–3950
阻力位: 3950, 3994
支撑位: 3900, 3880
📈 交易计划
✅ 买入区1: 3904–3902
止损: 3898
目标价: 3910 - 3915 - 3925 - 3935 - 3945 - ???
✅ 买入区2: 3885–3883
止损: 3878
目标价: 3895 - 3905 - 3920 - 3935 - 3945 - ???
⚠️ 卖出区 (短线/陷阱): 3949–3950
止损: 3955
目标价: 3940 - 3935 - 3925 - ???
⚠️ 风险管理提示
流动性可能在3950区域上方被清扫后再调整 → 需等待价格行为确认。
避免在高点FOMO,仅在价格调整至支撑区域时优先买入。
在美联储意外政策消息前应适当减轻订单量。
✅ 总结
黄金正处于上涨趋势的“黄金阶段”:政治不稳定 + 美联储温和 + 避险需求 = 买入是主要策略。计划优先在3904–3902和3885–3883区域积累订单,扩展目标至3950–3990。卖出仅为流动性区域的短期策略。
📢 关注MMFLOW TRADING以获取实时更新和团队的BIGWIN设置!
