Multi-Timeframe Alignment: $GT Primed for SurgeWeekly:
GT above 200DSMA(
GT above 200DSMA(19.8) – structural bull trend.
Daily: Channel support at
21.2holds strong.4H:BullishdivergenceonOB Vindicator.WithaltseasonRO historically exceeding 200
21.2holds strong.4H: Bullish divergence on OBV indicator. With alt season ROI historically exceeding 200 GT is a core holding.
在观点中搜索"divergence"
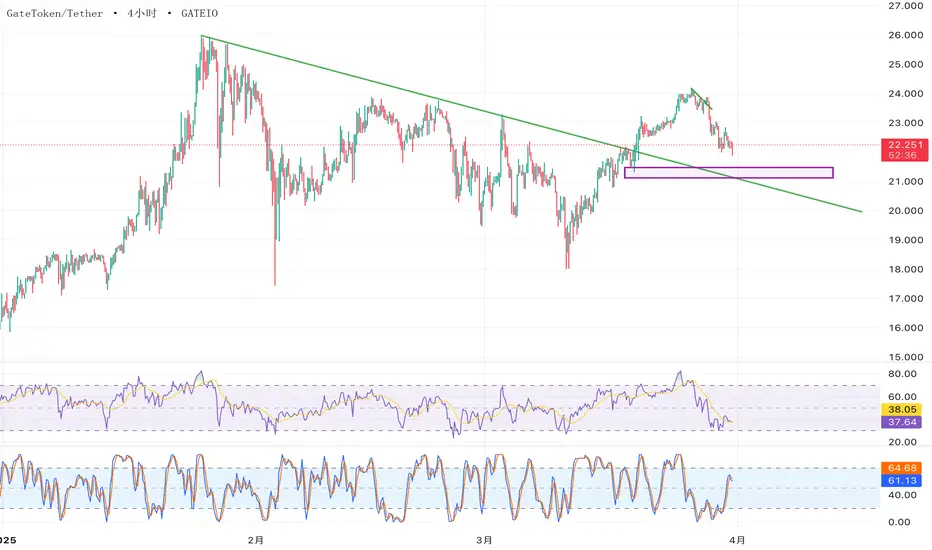
1-hour timeframe technical analysisThe current price has clearly encountered resistance at the 24.80 key resistance zone on the 1-hour chart. This aligns with a bearish crossover signal from the StochRSI in the overbought zone (>80), indicating exhaustion in short-term bullish momentum.
On the 4-hour timeframe, the MACD histogram shows a bearish divergence, further supporting expectations of a pullback. Focus on the historically strong support zone near 23.46 (the launch point of three previous rebounds). If the price retraces to this zone, consider分批布局多单 (scaling into long positions) upon observing the following signals:
Candlestick confirmation: Long lower wicks/bullish engulfing patterns.
Volume-price alignment: Declining volume during dips and rising volume during rebounds.
Indicator reset: StochRSI retreats below the mid-level (50) and forms a bullish crossover.
Trading Strategy:
Entry: $23.46 ± 0.3 range, divided into 2 batches.
Stop-loss: Daily close below $23.00 (previous low platform).
Target: Break above 24.80 to target 26.50 (Fibonacci 138.2% extension).
Risk Alert:
A breach of the 4-hour EMA30 (currently 23.90) during the pullback could trigger a deeper correction to the 22.80 neckline support. Remain vigilant for false breakouts.
While the weekly chart remains in an uptrend channel, light positioning is advised to capitalize on pullbacks.

Bitcoin 22.03.2025: +0.32%
: $84,418.94
: $80,000-$82,000
: $85,000-$88,000, $90,000-$91,000
1. BTC is currently fluctuating within the $83,000-$85,000 range.
2. Short-term consolidation may continue, with key support at $80,000-$82,000.
3. Major resistance zones are at $85,000-$88,000 and $90,000-$91,000.
4. The 4-hour chart exhibits a bearish trend but has broken above the bearish Kumo cloud.
5. On the monthly chart, the 9 EMA continues to provide support, while the MACD pattern resembles the setup before the major rally in June 2021.
Market Sentiment
1. Overall sentiment remains cautiously optimistic, but short-term uncertainty persists.
2. Strong divergence between bulls and bears, leading to indecisive price action.
3. BTC spot ETF investors maintain a positive outlook, with a noticeable rebound in U.S. investor buying interest.
Capital Flows
1. BTC spot ETFs have recorded net inflows for six consecutive days, totaling $83.09 million.
2. ETH spot ETFs have seen net outflows for 13 consecutive days, amounting to $18.63 million.
3. Large institutions (e.g., BlackRock, Fidelity) are executing sizable buy orders.
4. The derivatives market is experiencing net inflows, while the spot market is seeing slight outflows.
Macro Factors
1. The upcoming FOMC meeting could be a key turning point for market trends.
2. Pakistan's proposal to utilize surplus electricity for Bitcoin mining indicates a shifting stance on crypto in emerging markets.
3. The Fed’s balance sheet reduction may have limited long-term impact on BTC, while broader monetary supply (M2) could play a more significant role.
Outlook
1. In the short term, BTC is likely to consolidate within the $80,000-$88,000 range.
2. Investors should closely monitor the impact of the FOMC meeting on market sentiment.
3. Over the long term, continued institutional inflows and supportive policies from emerging markets may drive BTC higher.
4. The market may continue to see BTC outperforming ETH.
Risk Warning
1. Investors should remain cautious, closely track market developments, and adjust strategies accordingly.
2. Short-term uncertainty persists, so it is advisable to monitor support and resistance levels, as well as the FOMC meeting’s impact on the market.

Jasmy when to short?1. 1H chart still not see any divergence btw price and volume
2. need to be patient, wait for volume spike with declining price
3. don't try to short the first peak

震荡趋势中背离指标的运用,以比特币为例指标主要分为两大类: 趋势指标 、 震荡指标
指标 背离 往往在 震荡趋势 中准确率更高。
在运用震荡指标和背离前,我们必须分析当前市场行情到底是处于 趋势行情 还是 震荡行情 。
在六月初的这段走势中,合约头寸处于历史高点,交易所出现天量抛盘,因此属于趋势行情,并不适用震荡指标,此时如果你采用背离、超卖等概念进行抄底操作,只会被套在高位站岗。
触底反弹后,合约大部分爆仓,现货交易量低迷,比特币的走势基本上完全受控于美股走势,处于低位震荡区间,因此完全适用于震荡指标,此时采用观测背离方式进行交易,会有胜率可观的可操作性。
为了更好地判断震荡行情,我使用最新的 PineScript v5 版,开发了这款自动绘制背离趋势的指标:
也欢迎大家在评论区讨论,你是使用何种方式判别趋势行情与震荡行情的。

MACD 的能量与价格发生背离时,价格大概率发生反转欢迎来到 BTCover 的 Tradingview 脚本教室。
利用 MACD Histogram Up and Down's Energy 指标,你可以快速查看到 MACD 的 Histogram 能量如何,在哪里发生了背离。比如我举例的这个价格区间:
1. 先看上方的价格区域:日线级别连续的触及价格低点
2. 再看下方的MACD:MACD Histogram 的能量不断降低
说明下跌的能量越来越低,发生了价格和MACD的背离,随后迎来的价格的反转。
以上是关于指标的一个应用场景,仅供参考。
感兴趣的朋友可以在社区指标中搜索添加该指标来使用,如果有问题欢迎留言,谢谢你的点赞!

做多LOOKS, 1.7-1.75分批吸,止损1.66,看到至少2.1
Bullish Crab pattern in 1 Day Chart. + RSI Bullish Divergence
Potential Bearish Gartley pattern in 4h Chart
D点踩了两次,形成背离,吸筹充分,现价附近估计不是终极目标
先看到2.1 附近, 第二目标2.3
基本面: 还不错吧。 x2y2凉, Looksrare vs Opensea Benchmark, NFT持续是熊来前的热点, Looksrare最近交易额起来了

做多APE,现价或者9.7-9.8进,止损9.4-9.5,看到至少11.7
Bullish Gartley + RSI Bullish Divergence in 15 min Chart.
叠加我个人的进场指标信号。
First Target Price: 11.2
Second Target Price: 11.7
Third Target Price: 12.5


BSV 3日线 BSV 3日线
这货没涨,趋势上处于巨大的通道内,没有完全脱离上升通道内部,未来也不知道什么时候能突破该通道。
交易量方面,这几天的几根3日线,交易量非常大,已超过2019年5月份拉盘3倍时候的交易量,说明卖盘(供应)还是很大,暂时不会卖方主导行情。
RSI方面,通过日线级别的bullish divergence,上涨到220附近,这几天完全跌回上涨最初的位置,需求发力,后期堪忧。历史上RSI 在36附近有5-6次的大反弹。
操作建议,等待130左右的便宜筹码。


从上一轮牛市的视角分析LTC的见底之路LTC直上直下的特性在币圈广为流传。
上半年牛市急先锋,下半年熊市带头跳水,引崩主流币。
18年熊市,LTC从450美元跌到20美元,跌幅95%+不可谓不惨烈。从周图表中可以看出,见底的过程是漫长且曲折的,仅从MACD指标的角度与价格进行对比分析:
1)2018年4月到9月,下跌过程中MACD轴不断缩小。MACD轴=DIF-DEA之差,这仅仅表明,向下的趋势下跌加速度减缓,但速度依然是增加。
2)2018年9月底出现了第一次金叉。金叉位置距0轴较远,显示出了严重超卖。但是金叉之后,价格并没有上涨,而是以横盘方式继续让指标钝化,下跌趋势暂时中止。
3)2018年最后一个极度,价格再度暴跌,价格创新低,但MACD蓝线(DIF线)未创新低,形成了背离,并再次金叉。这个时候下跌趋势依然有,但势头没有之前强,多头力量在酝酿指中。行情才触底。
从今年7月份的高点下跌后,LTC现在经历的是MACD轴逐步缩小的阶段,这表明下跌的加速在降低,但是速度依然是在增加。
底部的第一次金叉还未出现,如果价格在40美元横盘,则可能出现出现第一次金叉。数字货币的熊市往往是深不见底,第一次金叉很大概率不是底部。
那么如果符合上一轮见底的MACD第二次金叉,且背离,则行情可能还要创新低后才会形成这个条件。


日光之下无新事BITSTAMP:BTCUSD BITFINEX:BTCUSD
Waiting PhaseD PhaseE/
Waiting Long/Short meeting/
Waiting circle Bottom Divergence
等待周线 月线指标到达区域位置/
等待市场情绪发生/
等消息/等信号/
......

