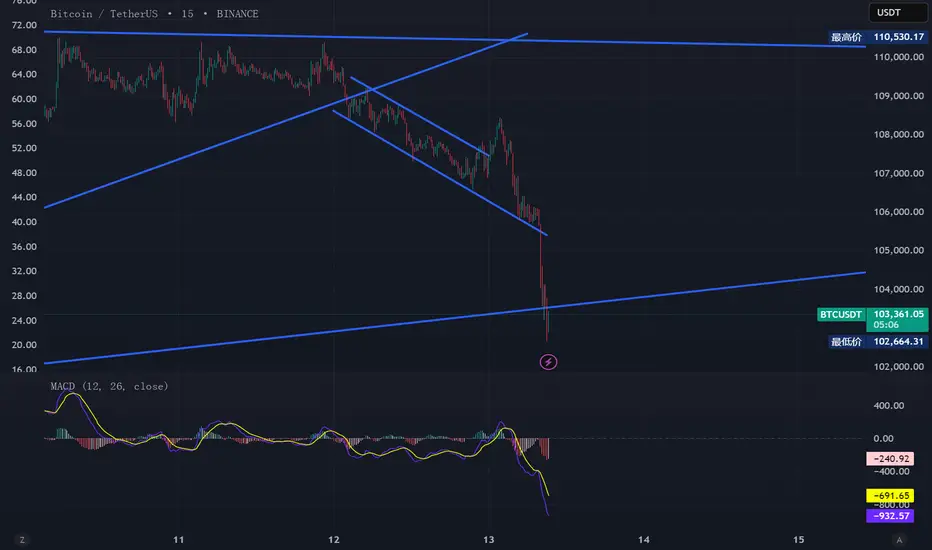
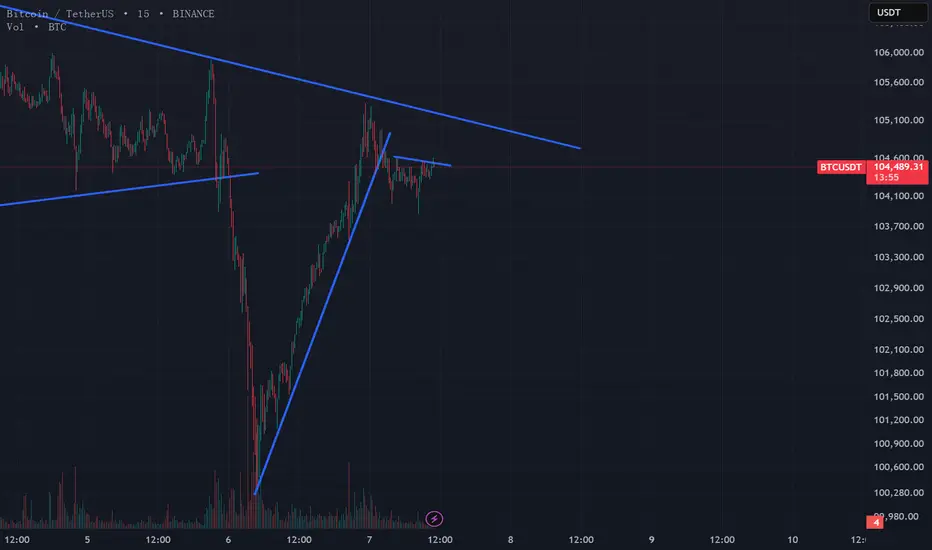
三角趋势破位,爆拉画门砸穿——高杠杆清算的剧本完美上演。周末正式进入低交易量的量化行情阶段。
我在上升通道突破时追了多,一度浮盈20%,但贪婪作祟,没设止损,最终在10点半含泪手动止损,后半夜直接破位跌到 102345,才算给了我一个心理安慰。
这波“画门”符合0612和0617两个高点连成的下跌趋势线。结合 BTC、ETH 和 Crypto10 来看会更明显——虽然 BTC 离阻力较远,但 ETH 已经实际触碰并反压,而 Crypto10 作为加权平均指标,刚好踩在这个阻力附近,然后就迎来了一次大跌。
当前,BTC、ETH、Crypto10 的多个上升趋势线都已经破位,价格正站在一堆成本线上方。上下方支撑和阻力都比较远,尤其 0606 和 0617 这两轮清算之后,已经不是密集持仓区了。
这次亏损总结:
观察偏差:只盯着 BTC 和部分山寨,忽略了这次主力其实是 ETH 和 Crypto10;
操作失误:浮盈后太贪,取消止损,结果吃了整波下跌,反应过慢。
📈 山寨行情整理:
✅ 看涨:
AERO、RPL:刚好回踩上升趋势线;
LQTY:强势突破趋势线上方,尚未回调。
❌ 看跌:
HYPE:趋势破位后暴跌 28%,弱势明显;
MKR:破位下跌,虽只有 5%,但形态很难看;
QUICK:爆拉反弹回趋势线,标准诱多反包结构,值得开空;
SPX:暴跌暂稳,等待1小时反弹再找空点。
🤔 不确定:
UNI:目前处于大小周期趋势线之间,位置不上不下,观望为主。
📌 后话:
市场到了“拉一刀就死人”的阶段,方向不明确时一定要控制仓位和频率。建议现在的行情继续以“轻仓+耐心”应对,看清结构再出手。
趋势线

美日,M15,上破下降趋势线,H1看涨Fakey美日,M15,上破下降趋势线,H1看涨Fakey
方案1:H1单信号
H1,看涨FK,止盈一倍,止损19点收线的H1低点
方案2:
T点145.486,M15收线上破后,
进场:T点145.486挂多
止盈:目标W结构1倍145.722
止损:W结构次低点145.250
方案3:H1收线破T,突破多
进场:20点或21点H1收线破T后,收盘价进场
止损:H1突破K线低点
止盈:W结构一倍145.250或H1突破K一倍

【BTC三角震荡中的建仓反思】【BTC三角震荡中的建仓反思】
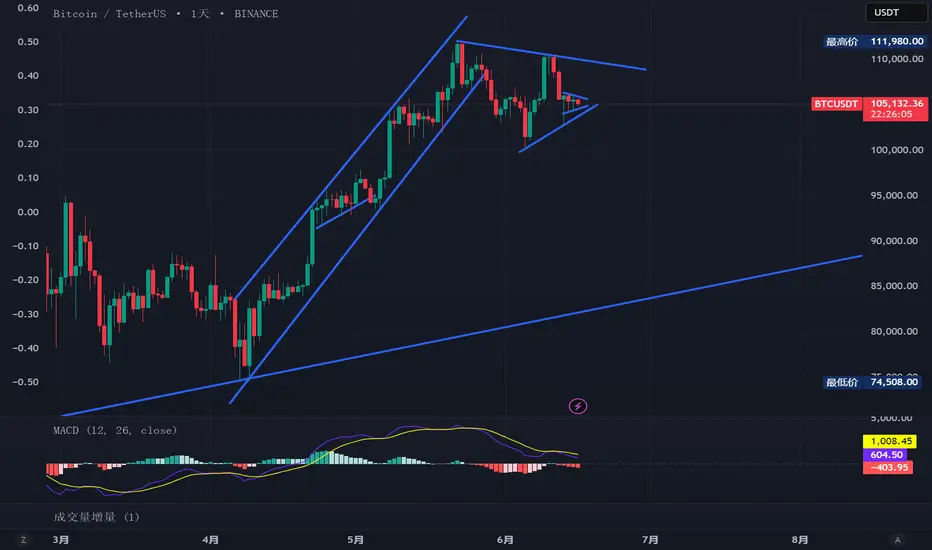
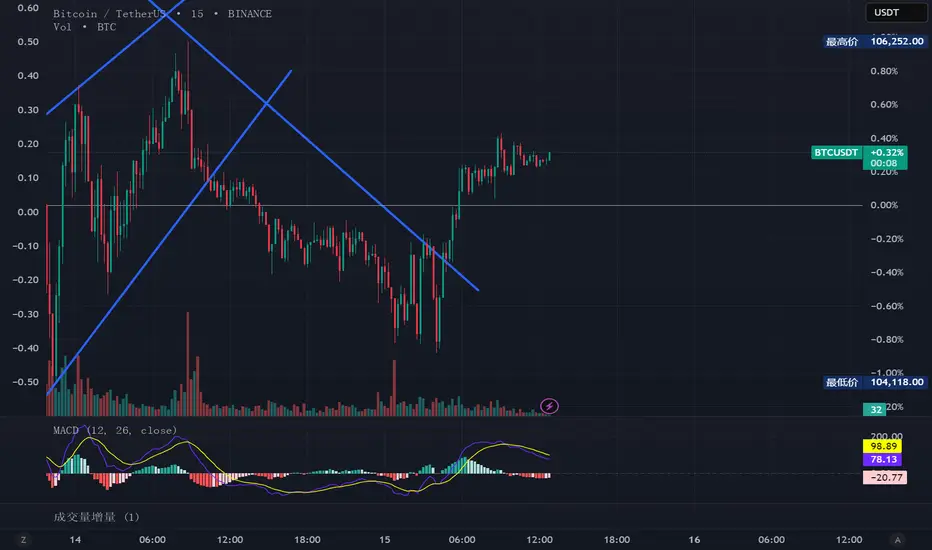
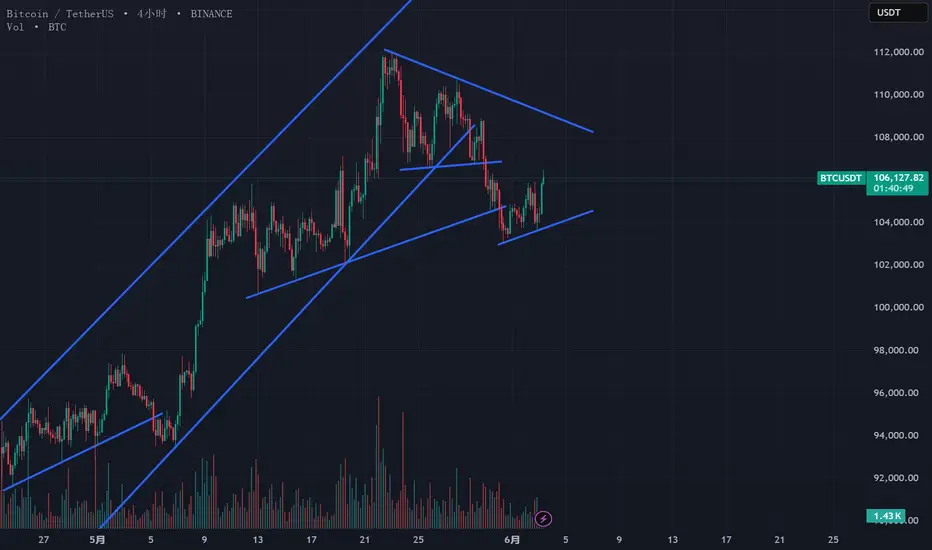
BTC中周期来看,6日与13日的低点构成的上升趋势线已经被破位,表面上看似跌破了三角震荡。但从更小周期(如15分钟)观察,103500附近已经两次触底不破,构成一个新的小型三角震荡结构。换句话说,大三角破位后,行情进入了一个三天时间维度的小震荡结构。
今天是周五,降息传言也基本尘埃落定。如果行情依然维持震荡状态,真正的趋势突破可能要等到今晚美盘之后(北京时间20:30以后)才会清晰。
我保持之前的观点:现在是值得建仓的时机,前提是你有清晰的交易系统。
📌 近期最易亏损的典型行为:
高杠杆 + 高频交易 + 小幅亏损连击
很多亏损并不是一次暴击,而是“连续的小额失败”,它们往往源于非计划性追涨杀跌,特别是在震荡区间内错误期待趋势突破。
✅ 我的对策与建议:
在结构反转点建仓(即便失败,后续仍有高概率的二次反转平仓机会)
该止损就止损,不要盼望行情总能“回本”
短时间内连续看错三次以上,必须强制冷静处理情绪,别让亏损的情绪驱动新一轮非理性交易
🔍 市场结构补充:
Crypto10 结构和BTC类似,也处于 6月18日以来的小三角缩量震荡中
**更大周期(日线、三日线、周线)**仍然在等待方向明确,不建议重仓博弈
Quick($QUICK) 近期有破位嫌疑,日线形态偏空,是我关注的空头标的
📌 总结:
三角震荡末期,是最适合系统型交易者进场布局的位置。此时行情收敛、结构清晰,但同时也极易诱发非系统性交易导致的连续亏损。信号没来,就按兵不动;信号来了,就照系统执行。

今天是个值得开仓的位置,重新出发!📉 惨烈回撤,重置蚂蚁仓
BTC今日横盘,但我高杠杆的"蚂蚁仓"策略遭遇暴击——从100 USDT冲到300+,又跌回14刀。被迫充值重新入场,心态缓了好久才恢复,以下是详细复盘:
📌 做得好的地方
早盘成功捕捉到SPX在日线阻力位的回撤。
BTC从105k冲108k期间,追击多个山寨币初期获利不错。
止损管理进步:BTC首次在108k受阻后及时上移止损,合理保护了本金。
❌ 翻车操作
选错标的:BTC企稳时山寨币跌得更凶,多次误判假底部。
零BTC持仓:完全避开BTC,全仓弱势山寨。
忽视反转信号:BTC在105600/104100/103400二次三次探底时,明明尚未反弹,我却重仓山寨币多头。
过度自信时机:仓位梯度尚可(5k→-200→4k→-100→3k),但方向全错。
🧠 核心教训
方向大于一切:再好的仓位管理也救不了错误的市场判断。
信号过载陷阱:矛盾指标太多导致FOMO式追涨杀跌。
弱势币种双杀:BTC高波动反转期玩弱势山寨等于风险加倍。
📊 当前观点
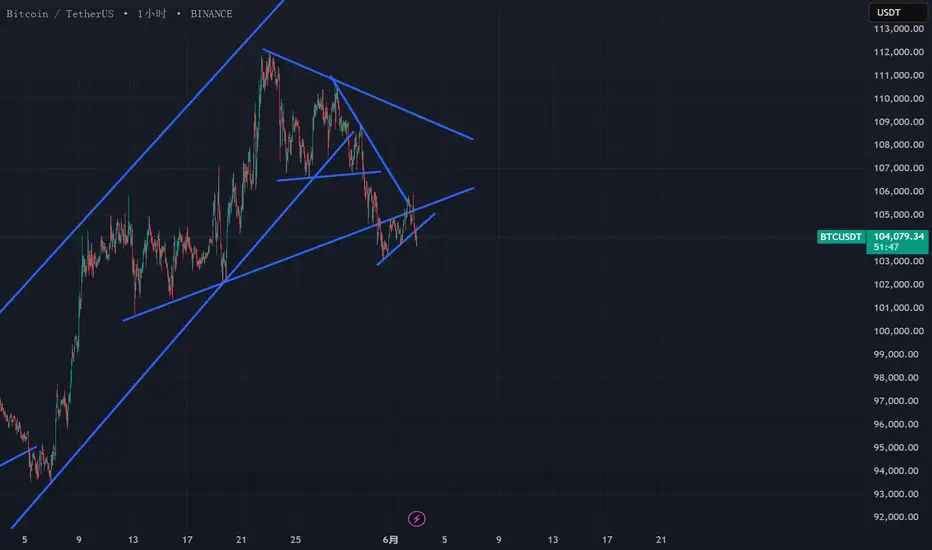
BTC沿0606–0613支撑趋势线反弹7小时,现处于三角收敛末端,多空突破都是好机会。
Crypto10指数更弱:已跌破趋势线+6月13日低点,勉强守在6月6日基准线上。
🔁 后续策略
15分钟MACD出现死叉,激进者可考虑短空。
做多需等待15分钟MACD下次金叉。
山寨币后续筛选更强标的和更佳入场点。
BTC会等待右侧行情大杠杆买入。
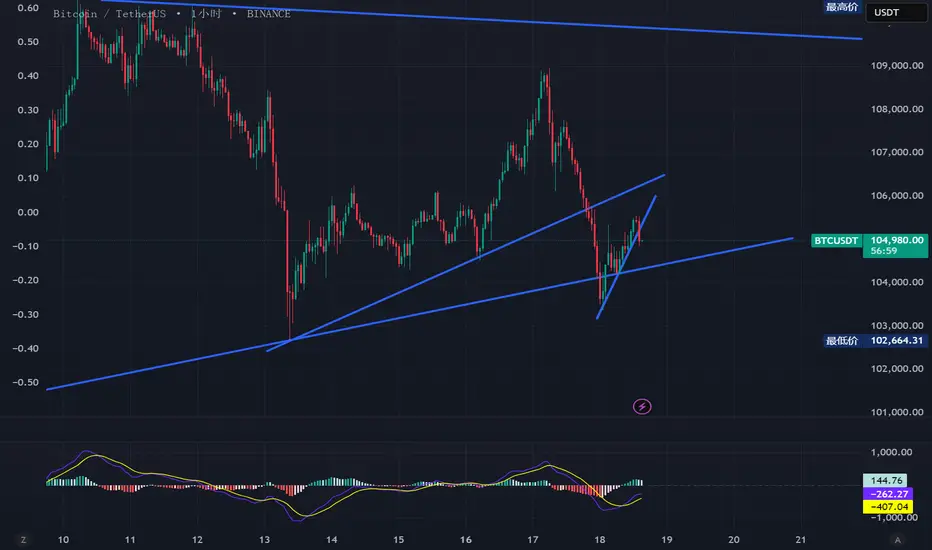
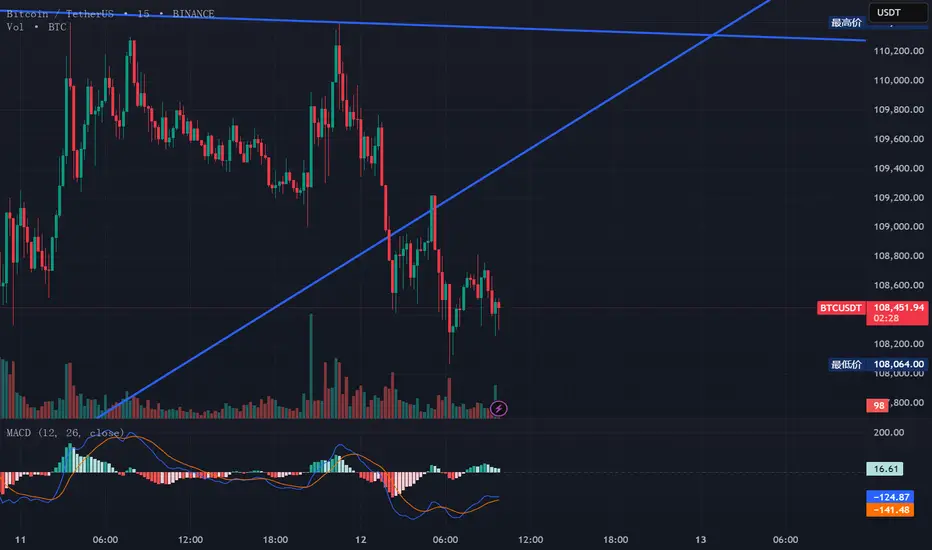
BTC昨天只是短期止盈踩踏。这不是正式下跌,只是止盈踩踏。
BTC这波下跌并非新一轮趋势开启,而是周末三探底大涨后的集中止盈出场。从技术结构来看,日线MACD再次靠近金叉,对应的是6月11日那波三探底失败后的修复行情。
这波修复在四小时图上体现为周末大涨;而今晚1小时的回调,则显露出可能进入4小时死叉的苗头。目前短周期(1小时)与日线方向一致,但与4小时冲突,提示我们进入“时间换空间”的三角震荡尾端阶段,正试图向上测试11w这一压力区域。
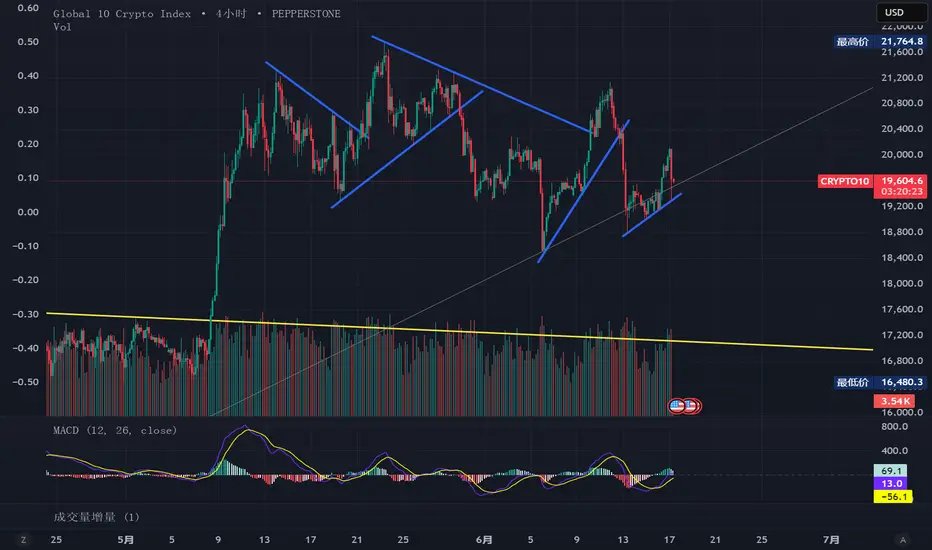
Crypto10 仍有韧性,但需警惕过早介入
Crypto10在最近一波上涨趋势线附近快速止跌反弹,表面是好消息。但从更大周期看,1小时与4小时仍处于下跌消化阶段,这波反弹或仅为空头止盈释放动能。
如果你参与现价做多,止损需要非常紧凑——随着每一次摸高失败,真正突破失败后跌幅只会越来越大。如果尝试做空,大杠杆止损可以设在局部高点;若目标是吃下整个震荡上沿突破后的行情,那止损就必须放在11w上方。这种情况也许更适合用期权布局,买入月末11w以上的看涨。
山寨回顾:损失惨重的一夜
昨晚我追踪的山寨在上涨行情中强于BTC,结果导致此前空单全线止损;虽然随后反手追多也吃上了一段涨幅,但半夜的止盈下跌再次吞掉利润,整体净值未有增长。震荡行情中方向频繁切换,仓位与止损控制成关键。
当前操作策略
BTC:震荡上行阶段,若短周期(15分钟 / 1小时)向上,可轻仓多单尝试。但需严格设定止损,勿恋战。
山寨:当前我已重开多仓于 ASX:MKR 、 GETTEX:HYPE 、 SP:SPX 、 GETTEX:RPL ,但建仓点距大跌低位过远,如果以大跌低位设止损,全被触发将导致超80%亏损。我正在重新思考这些仓位的止损策略,避免账户回撤过大。
结语
市场仍处三角震荡尾端阶段,情绪反复无常、结构拐点临近。在这种局面下,低杠杆 + 快进快出 + 严止损 + 重思仓控才是稳健应对的首选方案。
欢迎分享你在这种行情下的策略与看法。
BTC短线震荡,寻找山寨高位潜在回调机会周五大行情以至于这三天都在三角震荡振幅缩小中。
本来觉得行情依旧没什么可以说的,照惯例看完BTC15分钟缩幅震荡,1小时没出趋势,4小时两个低位支撑的上升趋势线的下边缘,日线双摸高回调状态。
但是看到crypto10的15分钟的三探底要比BTC更接近4小时支撑的下边缘,不过悲观的看也算是破位徘徊。1小时看也是没趋势,缩幅震荡。日线在其它指标看,比如macd看表现要好点,跟前两天说的BTC之外的大市值行情要更好有关。
山寨致力于空这些选手,spx、quick、neiroeth、lqty、mkr、uni、rpl、hype、aero。原因是它们的日线涨幅可观,我觉得震荡or下行的btc能够让它们大幅回调。
目前做空仓位有spx和aero,其它没看到比较好的做空位置,会考虑在15分钟趋势与1小时或4小时的趋势同向的时候,以及大饼在15分钟趋势同向开跌的时候做空。
周末复盘:btc并未走出明确方向📅 市场复盘 & 操作计划
一、BTC走势梳理
周五出现超跌反弹,周六反弹后再次回落,但周日一觉醒来又快速修复,经典的“周五大波动 + 周末振幅收窄”剧情再次上演。
BTC在15分钟周期上已经突破下跌趋势线阻力,但从更大周期(4小时、日线)来看,仍然处于震荡区间中,并未走出明确方向。
二、Crypto10与山寨强度观察
相比之下,Crypto10曲线走势更偏强,大饼以外的 ETH、SOL 等公链币种在横盘后反弹的幅度与节奏都优于 BTC。
🔍 结论:如果短线看涨,更值得把目光从 BTC 转向 ETH、SOL 这类主流公链。
三、山寨币个人观察重点
本周我将关注那些日线回调充分、有可能反弹的品种:
👀 多头关注:RPL、NEO/ETH、HYPE、AERO、MKR、LQTY、UNI
🔻 空头想法:SPX、MKR 三顶压制明显,已有空头打算,但尚未动手,等待信号确认。
⚠️ SPX 的位置太尴尬,上次做空一度翻倍,后来回吐60%。反而多头做 RPL 收益不错,短线浮盈约 30%。目前 SPX 尚未有明确再空的动能。
四、短线策略简要
BTC:目前空仓观望,今日不操作。
山寨:优选右侧信号明确的品种,15分钟 / 1小时 / 4小时出现金叉或死叉共振时考虑追涨杀跌。
🗣️ 欢迎大家交流自己的币种关注列表或建仓逻辑,有哪些交易信号值得分享?
冲高失败情绪释放之后,方向仍未明朗📉 一周复盘 + 市场观察:情绪释放之后,方向仍未明朗
这一周行情虽急涨急跌,振幅看似巨大,但放在过去两个月的连涨背景中看,其实更像是一轮趋势行情的尾声整理,并未打开新的趋势空间,仍在为下一波行情做铺垫。
💡 个人持仓与操作记录:
BTC:昨天在 103200 建多头,104700 附近止盈,当前空仓。
山寨:计划小杠杆做多,大杠杆做空 SP:SPX ,昨晚在 1.48 开空,1.39 加空,1.32 开始止盈,止到了 1.34。后续留下少量仓位被止损,之后尝试在 1.43 开多,睡觉后被 17.7% 振幅的小时K直接扫损。
📊 BTC节奏分析(基于15分钟与4小时):
周五大跌后一根大下影线,随后急速反弹至 104000,并开始低位“高点更高、支撑更高”的上涨结构。
上升通道逐步变窄,每一次向上的蓄势时间变长,显示多头力量在衰减,但空头并未组织起有效反击。
周末倾向震荡,目前是缩量上涨格局,预计在今天就会结束这个节奏,向上或向下破位。
🧭 多周期展望:
4小时:跌幅收窄,有进入金叉的趋势;
日线:处在“二次冲高失败后的回调震荡”区间,方向尴尬,向上缺乏推动力,向下情绪释放又太快,仍需时间或消息面刺激。
🔎 其他资产与结构观察:
Crypto10 与 BTC 节奏相似;
ETH:比 BTC 更强,在触碰 1小时上升趋势线之前已止跌,若看涨一周内走势,ETH > BTC;
山寨币:分化严重。多数在 6月12日突破失败后,走势偏弱:
有的横盘,有的靠消息面拉升后天地针洗盘;
有的持续阴跌,直接破新低;
总体是高杠杆清仓、流动性塌陷的结构。
🔥 当前重点关注标的: SP:SPX
日线上遇前高阻力开始下行;
节奏与BTC相似:跌得太猛,节奏上难以承受;
策略上倾向 逢高开空、带窄止损、盈利后平移止损至成本线。
📌 小结:
目前市场正处在一个情绪释放后的真空期,多空都没有决心继续大幅推进,结构走弱但仍有支撑。对于我个人而言,目前是等待新节奏形成的阶段,偏短线、轻仓、强调止损纪律。
欢迎大家讨论交流,特别是你们是如何判断当前这种“情绪下沉但结构未破”的行情节点的?

BTC进一步打开4小时跌幅
这波操作损失惨重,源于自己没有严格执行原本设定的计划。
我是在 BTC 107400 附近建的高杠杆多单,配合的是 1小时金叉信号,浮盈一度到 108000。但我没有执行**“浮盈后上调止损”的纪律**,本来止损设在强平线附近,结果回调后被动出局。回头看,这波走势从 7万爬上来的多头一旦失守,后撤是理所当然的。
🚨 操作失误点
• 本该 107300 调整止损的位置没做处理。
• 昨晚 107400–107300 是个很好的反手开空区域,如果当时止损设置在 108500 附近开空,今天刚好吃到4小时跌幅的主段。
🧠 当前结构判断:
【BTC】
• 1小时金叉失败 ➝ 4小时MACD 死叉打开中。
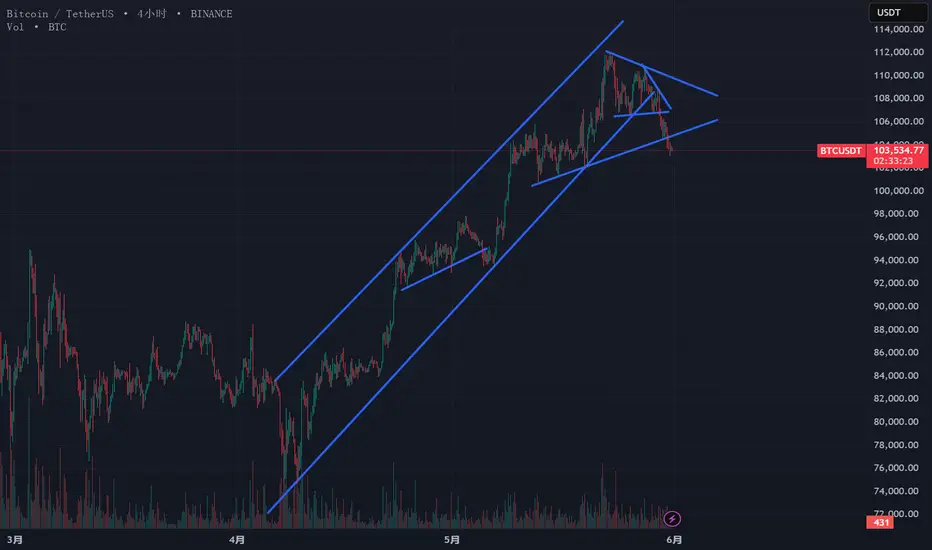
• 结构上属于:4月起涨破新高 → 二次破高失败 → 回调结构。
• 当前位置卡在:4月末7w—6月6日10w的上升趋势线附近,但周期跨度过大,我不太看好能站稳。
【Crypto10】
• 同样是在大级别两根支撑线间挣扎。
• ETH 是主力,它在 4小时结构中还距离趋势支撑位 100点,2500–2400 区间是窄止损开多的位置。
【山寨】
• 6月12日“三冲高失败”之后情绪崩塌,开始群体性流动性下杀,很多品种破新低,技术上已经在画标准的下跌通道。
❓迷思反思
空仓状态下我看着 BTC 在 103000 附近被右侧资金追空,有点疑惑 ——
这波右侧滚仓式的开空,我真的会参与吗?
我的系统是基于15分钟和1小时结构进场,像这种连续杀跌后的追空并不适合我。对于我而言,这类行情更像是找止盈点,而不是入场点。所以我错过了,也不打算参与。
但我也好奇:
你们中有没有人会在这种走势下建仓?你们的信号源是什么?
欢迎分享不同系统的判断方式。
📌 后续交易计划
• BTC:等 15分钟趋势反转信号出现后考虑低杠杆建仓;若出现浮盈就快速移动止损保护利润,小小的做多。
• 山寨:我仍然很看空 SPX,上次盯盘错过了 MASK,这次会更关注机会,准备择机开空。
BTC三冲高失败,市场情绪走弱📉 BTC三冲高失败,市场情绪走弱
BTC冲击 110300~110500 区间三次未果,显示当前加密货币场内情绪独力难以突破该压力位。
我这轮建仓位置还算不错,三冲高后在 109600 浮盈区间平多,反手做空,108600 止盈。当前暂时观望,考虑BTC 与 Crypto10 的15分钟反弹走势再做决策。
📊 技术结构更新:
• BTC
○ 1小时:三冲高失败后快速下跌,目前跌幅收窄;
○ 4小时:6号与9号的上升趋势线被跌破,MACD 死叉,跌幅放大中;
○ 日线:形态偏弱,在前高压制下冲高失败,成交量一般,K线在金叉附近横移 —— 这或许是一个**“冲高无力 + 顶背离”**的组合信号?
• 山寨币
○ 有趣的是,部分山寨币的支撑表现比 BTC 更强。昨晚 BTC 大跌时,山寨币普遍仍在 4 小时的上升趋势线上方徘徊,说明市场的非主流情绪依然高涨。
• Crypto10 指数
○ 日线:略强于 BTC;
○ 4小时:死叉信号比 BTC 晚了两个周期,目前距离 1小时上升趋势线还有约 1000 点;
○ 15分钟:反弹减弱,当前止盈中,关注是否出现三重支撑结构或趋势线破位再跌的机会。
📌 操作计划(计划即纪律)
✅ 支撑区多,反弹高空
✅ 仓位重,但持仓不久
✅ 止损要小,位置要准
在 BTC 的三重支撑位附近尝试做多,如有快速反弹再于高位做空。高杠杆仓位需配合极窄止损,不能长时间持仓。
🧠 策略反思
目前市场对 BTC 冲高动力不足,若无新的外部催化,局部反弹难掩结构性回落压力。不过,Crypto10 与山寨币的强韧表现值得跟踪,可能蕴含潜在机会。
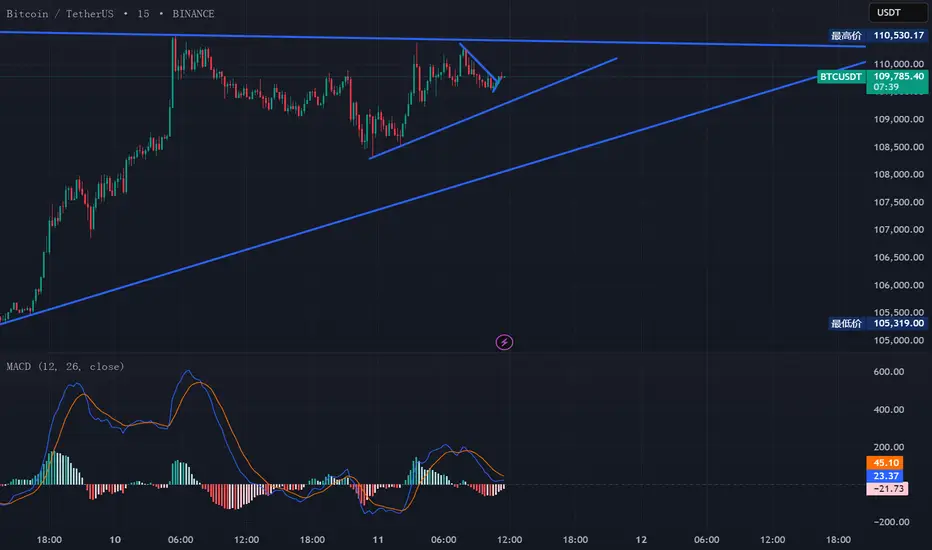
BTC突破临界点,多头情绪酝酿中已止盈一部分仓位,目前保留约 3 倍杠杆继续持有,看多后市。
🟡 BTC:突破意图强烈
过去 24 小时,BTC 两次上探 5.23 和 6.10 所连成的下降趋势线压力位,表现出明显的突破意图。
目前价格在 109600 附近横盘整理,1h 和 15min 多次纠缠,考虑到现在是上午低量时段,这种走势是合理的。
• 4h MACD 开始缩量,有潜在金叉趋势;
• 当季合约持续升水,说明多头结构仍在。
🔵 ETH & 山寨:震荡中的分歧
ETH 和 BTC 表面都卡在压力位,但 ETH 其实是站在 5.14 和 5.29 连成的上升趋势线上,而 BTC 则是在测试下降趋势线。这个结构差异值得留意。
• Crypto10 在 1h 上已经突破下降曲线,同时也完成了更大周期支撑的回踩;
• 但目前尚未突破 5.29 的结构高点,距离 5.23 更远。
Crypto10 的 MACD 没有继续下行趋势,相对乐观,只是 BTC 和 ETH 目前尚未形成同频上涨,节奏仍在蓄力。
🔴 当前仓位策略
如果我不是币本位,其实已经转去做 ETH 了。
但现在的行情高位未突破,15min 跌幅正在收缩,考虑博突破短线波动:
• 在109600再建多仓了,20倍杠杆,止损设在 107000;
• 防止强平:在 109300 设置预警,根据 15min 节奏及时调整。
⚠️ 教训与交易纪律
昨天蚂蚁仓山寨本盈利两个仓,但因 WIF 的强烈回调导致强平,白亏一笔手续费。
**交易新纪律:绝不再让账户触发强平。**强平不是止损,是送钱给交易所的蠢操作。
✅ 总结:
• 大盘结构正在逼近突破,短期震荡蓄力;
• ETH 稍强于 BTC,山寨节奏分化;
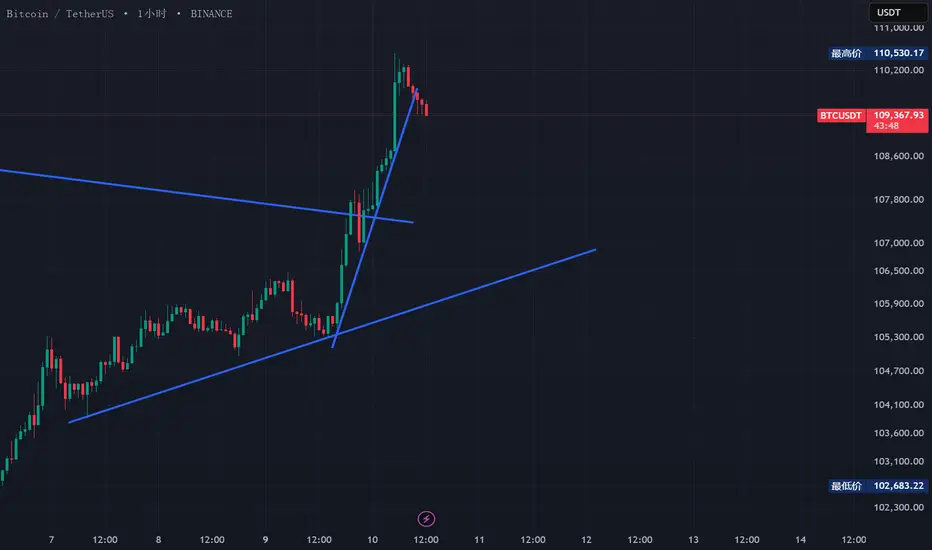
【BTC复盘 | 状态恢复 VS 行情错过】昨天没更新,因为我强迫自己离开市场一天。
原因很简单:状态不对。
周末盯盘太久、操作太多,情绪逐渐上头,我察觉到疲劳和冲动,决定主动远离市场一天冷静。
🧠 心态与操作复盘
代价:错过了一波大涨行情。
反思:状态异常其实在前一天就有苗头,我若能更早识别,或许只需几个小时的调整。
幸运的是,我是币本位账户。
不幸的是,行情是在我105500附近35倍多单止损之后启动的。
但我也知道:当时的我并不适合继续重仓操作,高杠杆本身就不合理,好在我配了极小止损。
📉 若我昨天在场……
如果我在,可能会试图在107300附近开空。
但那时市场正在强势突破,空单并不占优势。
相反,105200~107000 区间我会比较犹豫,因为那段时间山寨币没太跟随上涨。
当然,这波突破正是这段时间蓄力的结果,也导致了后续从107300到11万的强攻。
📈 从趋势看行情
连续十几天下跌后,两天涨回来了。
如果不算周末横盘,这波反弹速度确实很快。
若目标是“破前高”,那么这波涨幅并不算超涨。
如果只看这两天本身,当然属于强劲反弹。
🧭 当前行情结构
BTC:
周一大涨
1小时级别进入MACD死叉
4小时缩量调整,有金叉迹象
日线MACD接近金叉
山寨币 & Crypto10 指数:
前期下跌趋势线被打破
目前处于短期调整阶段
有清仓获利盘后的蓄势破新高的可能
✅ 操作策略建议(供参考)
📌 如果看多:
不追高,待1小时死叉消化、15分钟形成右侧信号时再低杠杆开仓。
若放量下跌,就不上大杠杆,继续右侧等机会。
杠杆不大时可以考虑逐步建仓,参与可能的“破新高”行情。
📌 如果看空:
没必要在情绪高涨时贸然进空。
等冲高失败、局势走弱时,机会自然会出现。
🧘 一句话总结:
错过不可怕,带着状态乱上才可怕。
冷静是交易的根本,行情还会有,状态错过就什么都抓不住。
疯狂之后,是空仓冷静的时刻今天操作频繁,状态开始混乱,必须复盘一下。
一、操作记录
BTC:
• 104600空单止损后,在105200追了15倍多单,止损设在100200。
WIF:
1. 1.0875 空单止盈,睡前反手开空。
2. 起床后在 0.880 附近止损开多。
3. 随后价格回落,0.876 再次开空,目前以小仓位持有,0.892 设置止损。
二、交易行为反思
这轮操作的特点是:高杠杆 + 高频反手 + 双向交易
虽然目前仍是盈利,但这类状态是危险的信号。连续操作、情绪波动,容易引发判断失真。
我必须停下来。
✅ 接下来的计划是空仓1-2天,让情绪恢复理性。
✅ 机会总会有,状态比盈亏更重要。
三、行情结构观察
BTC、Crypto10、山寨币:
• 周末表现出一种“市值越大越抗跌,越小越弱势”的格局。
• BTC 目前的上涨斜率减缓,但下跌尚未打开。
• 刚刚突破105300前高,在105900遇阻,7点附近同步看到 Crypto10 遇到下跌趋势线压力。
• Crypto10 离2327构成的下跌趋势线还有一段距离。
我的理解是:
市场情绪偏多,但结构性承压,弱势山寨拖后腿,BTC独立拉盘形成表象强势。
四、挣扎时刻与交易计划
我认为BTC该回调,但又舍不得高位追进去的仓位。
这种“反复自我怀疑”的心理很危险。我意识到,是因为我104600止损后受挫,才追了105200的单。
现在BTC只有一次明确支撑(100372),再砸下去可能无底。
向上空间虽有,但临近强阻力,进退两难。
我最终决定:
减持至3倍杠杆观望
若后续15分钟和1小时级别形成共振上涨,再考虑买回
五、当前市场信号
• 15分钟级别反弹软弱
• 1小时MACD死叉已开
• 2小时MACD死叉即将形成
不是积极的信号,交易上必须保守。
六、山寨币计划
• 小仓位空单持有中,等待15分钟级别金叉止盈
• 保持克制,不参与追涨或放大仓位
七、自我提醒
“盈利不等于状态好,频繁反手只会透支判断力。”
冷静下来,机会还在,心态先稳。
这就是我今天的复盘,感谢阅读,也欢迎大家分享你们的操作和思考。
—— END ——

BTC三突破失败同时又放量大跌一、BTC行情结构:深V冲高,陷入迷局
• 昨天下午市场出现了几小时的**“无量、稳定、方向明确”的超跌量化行情**,随后 20:30 开始进入美盘博弈时段,在 1 小时内强势上探,触及前期两个高点构成的下跌压力线。
• 当前结构:
○ 1H MACD 死叉,典型反弹止盈点;
○ 4H MACD 开口上扬,趋势正在酝酿反弹;
○ 两周期方向相悖 → 不做此类结构的行情(趋势不共振)。
• 我的处理:
○ 清掉昨晚 104900 开的空单;
○ 看市场两小时前反弹幅度不小,情绪偏多;
○ 虽然**大结构依然是“356日线三次冲高逐渐走低”**的状态,但昨晚的深V结构正在扰乱判断。
二、Crypto10 vs 山寨:分化持续,BTC干扰显著
• 看了一眼 Crypto10的356结构,昨晚的反弹还远未回到关键阻力位,说明市场还是被BTC主导节奏牵着走。
• 山寨方面:
○ 市场分化剧烈,个别超跌币种情绪极端。
○ 被MASK来回干废,百U小号直接被打穿。
○ 追空抓反弹都失败 —— 是我交易纪律的问题:没有遵守“趋势不共振不做”的原则,执行不到位。
三、操作策略 & 后市计划
• 当前持仓:
○ 虽然整体建议空仓,但我个人在104400重仓开了空单,止损设在104600上方。
• 后续计划:
○ 若后续站上压力位、形成突破结构,考虑右侧开仓;
○ 不打提前量,等确认结构给信号再说。
• 周末到来,可以考虑在105300-103800区间来回参与震荡行情(尤其注意周末大市值流动性不足,小币种波动大但容易被坑)。
四、附:山寨指数参考
对部分朋友找山寨情绪指标有帮助,这里给出三个山寨指数标的:
• Virtune Crypto ETP
• Bitwise 10 Index
• S&P Cryptocurrency BDM Ex-MegaCap Index
(注:这些指数仍然受到BTC情绪主导影响,暂不能完全作为“独立走势参考”,但值得参考权重币与BTC节奏的剪刀差。)
20250606(2):坚定自己的信念,错误交给止损今天早上市场一波跳水之后,钝刀割肉走了一白天的上涨行情,如果过于关心盘面,过于在乎 未实现盈亏 ,那可能心理压力会比较大,更严重的是耽误很多交易以外的事情。
所以标题也是说给自己听的。
既然BTC已经出现了新的低点,并且日线级别MACD还没有修复好,那就坚持“下跌还没走完”的观点,如果错了,自然有止损兜底。
综上,我确定了要走下跌行情的思路,并且认为下跌行情刚刚开始,所以对于一天的小刀慢磨,反而是思考在哪个位置做空。
操作计划:
1. 关注市场走势,当觉得小周期上涨乏力,并且存在优势盈亏比的时候,进场做空。
2. 每日从日线角度观测空头行情是否结束
3. 如果行情向下走了一段距离之后,放弃做空,因为大的周期还是看多,相较于做空,找机会做多有更大的利润空间。

BTC破位止损反思|操作失误复盘回头翻了翻我5月25号写的便签,现在看来真是有点讽刺意味:
“两个重要的做空行情不要错过,一个是周K的死叉,一个是日K死气沉沉横盘下跌,4小时左侧开跌,15分钟右侧反弹失败……这个时间节点在两三周内都不会再出现。”
结果呢?这两周不光来了,还扎扎实实地踩了一次坑。
📉 判断错误 & 操作失误并存
这波操作的问题有两个:
对日K周期判断失误
原以为会横盘后失败再下跌,结果是 5月28日直接破位,之后连续疲软,昨天(6月4日)4小时的反弹也完全无量,直接破位到 10w 边缘。
操作不利
想做的位置没开到;真正破位的时候,又没果断止盈。
比如:
本轮止损点设在 103000,结果被打掉。如果之前能在104200 附近破位止损,完全能避免亏损;甚至 103500 开仓后直接平仓都可能小赚。
整个阶段的多单多数是右侧进场,卧倒没动+止损执行,直接导致资金回撤。
✅ 小级别尝试修正操作节奏
昨晚大跌之后,BTC 5分钟级别出现三探底的上升趋势,我在 102200 开了7倍多仓,设了上升趋势破位止损。
第一目标达成后,5分钟MACD死叉减仓止盈一半;
剩余继续观望是否能演化成更大级别的反弹。
🌊 Crypto10 & 山寨操作回顾
Crypto10 在凌晨 4 点破位,如果当时醒着,我应该会主动平多反手开空,可惜人在睡梦中,错失良机。
山寨币普遍也进入了超跌反弹阶段,尝试用5分钟线进了些蚂蚁仓,死叉后果断清仓。
🤯 后市展望 & 操作计划
对后市坦率讲比较迷茫。昨晚虽然接了点小仓的多单,但方向上暂时没太大信心。昨晚说好要整理公链指数的计划,因为行情忙乱和操作精力耗尽,鸽了,明天一定更新。
📌 操作策略反思重点
多空方向错了就不该开仓;
真正破位后,要敢于止盈而不是幻想反弹;
对于右侧建仓之后的卧倒不动,是时候制定更动态的止盈/止损逻辑,不然小周期一反就被动止损;
未来仓位策略考虑:
低位蚂蚁仓+小级别右侧试单;
一旦级别放大(15min→1h→4h)再考虑加仓、反转信号共振确认;
动态止损公式思路持续测试:利润推进 + 时间推进 = 自适应止损逻辑。
如果你也踩到这一波,欢迎在评论区讲讲你对 周K死叉+日K破位行情的理解。或者你最近是怎么调仓避险、用小周期反打的,也欢迎分享。

大饼看涨卧倒不动,山寨寻求机会昨晚 10 点左右,BTC 出现**“穿针式下跌”,触及了15分钟上升趋势线的支撑位后迅速反弹。此后,价格沿着一个更小周期(约两天)**构成的下跌趋势线缓慢反弹,目前徘徊在 105000 附近。
🧱 山寨币分化:破位与强势并存
相比 BTC,山寨币这轮回调明显分化:
一部分前几天涨幅较大的,已经跌破趋势线,前期涨幅几乎全部回吐;
而另一部分则在趋势线附近出现强势反弹,结构依旧健康。
特别是 Crypto10 指数中,几大公链(非小市值山寨)走势相对稳健,表现为“跟涨不跟跌”。但由于 BTC 占比过大,Crypto10 本身也受到较大干扰。
我正在考虑自定义一个“公链组合”指数,用于更清晰地评估市场结构。今晚会尝试制作,明天分享给大家。
📌 BTC 仓位继续“卧倒”观察
当前 BTC 仓位继续持有不动,止损仍设在 103000。
虽然担心“穿针反弹”再次发生,也意识到不移动止损其实和山寨仓位过重时一样:缺乏纪律,但目前仍暂时观望。
💥 昨晚山寨操作小结 & 策略反思
昨晚确实抓到了一些山寨的上涨机会,但仓位过重导致回调时止损被打掉,没有留下利润。
最大的问题是:没有在获利之后主动上调止损,这暴露出操作上缺乏“止盈后缩小止损”的系统机制。
这让我开始思考:
是否可以建立一个机制,用“利润推进 + 时间推进”构造一个动态的止损调整公式?
比如:
获利达到 X% 或浮盈超过 X 时间后,止损自动上调至成本线;
随着浮盈扩大,止损同步上调至一定比例保护利润。
这是我接下来要研究和测试的重点之一。
🕵️♂️ 山寨布局策略更新
接下来的山寨交易,我会继续尝试:
在 1h 和 4h 出现金叉共振反弹的币种中,在 15分钟右侧买进
具体介入信号包括:
15分钟级别形成MACD 金叉;
出现三探底反弹形态;
明显趋势进入“进金叉”过程中的蓄势阶段。
欢迎大家在评论区交流你最近关注的强势币种,特别是结构健康、趋势明确的公链项目。如果你也在做类似的指数组合研究,欢迎互相借鉴思路。

大饼继续卧倒不动,山寨寻找入场机会【BTC短期上升通道复盘 & 山寨超涨行情回吐观察】
BTC 目前处在短时间内形成的上升通道中,15 分钟 K 线上可以清晰看到由三个高点与两个低点构成的趋势轨道。
刚刚触及上升通道的上轨阻力后出现回调,4 小时周期依然处于高位调整期,1 小时周期尚未有明确突破迹象。当前我选择仓位不动,并已将止损上调至成本线下方一点点的位置,避免大幅回撤带来不必要的损失。
BTC短期止盈目标先看 108500,但也会随着时间推移逐步降低止盈预期。毕竟现在才周三,市场留给我们操作的窗口仍然存在。
🪙 Crypto10 & 山寨币回撤情况
这轮回调中,Crypto10 和一众山寨币回吐了15分钟“三探支撑”后反弹幅度的一半左右。
不少前期超涨的山寨币已经突破了短期上升趋势的阻力位,形态严重偏离均值。不过山寨一贯如此——涨得狠时突破一切逻辑,跌起来也常常毫无预兆地破位。
目前整体来看:
回吐幅度并不算极端,保留了一半涨幅;
如果是做震荡区间的,现在是不错的低吸时机;
如果是做超涨博弈的,这里建议开始部分止盈。
整体大盘多数币种都处于**“腰部区间”**:
往上是前期高位,存在利润兑现空间;
往下则有较大技术面空间。
没有持仓的建议继续观望,有持仓的建议在通道内做低吸高抛。
😓 昨晚实盘小结 & 教训
昨晚追了一些山寨(在突破点附近),盘中一度浮盈 30%,但因为没有及时上调止损,结果一觉醒来,浮盈变成**-80% 的亏损**。这次教训很直接:
忽视了 BTC 在午夜 12 点附近处于通道上沿;
实际我是在晚上 9 点左右追的,位置本来不错;
这波属于超级小周期的上升,止盈止损也应该跟着小周期来处理;
因为贪了一个过夜,反倒让利润化为乌有。
📌 后续计划 & 社区互动
接下来计划继续寻找在15分钟下跌后出现反转趋势的优质山寨币,右侧开多,控制好仓位与止损。
如果你最近有观察到哪些结构良好、回撤后的强势山寨币,欢迎评论区一起交流推荐!

BTC多仓卧倒不动,空军建议等待,山寨伺机做多【BTC、Crypto10 与山寨币短线分析 & 操作思路】
昨晚 22:00 左右,BTC 和 Crypto10 在低位三探支撑失败后,开始出现无量拉升的走势。
从 15 分钟 K 线看,不仅是 BTC 和 Crypto10,常关注的一些山寨币也开始同步反弹:
• WIF:反弹力度大,目前已触及 5.23~5.29 两个高点形成的下降趋势阻力位;
• MOODENG:也回到了 5.26~5.29 形成的阻力区域;
• 还有一些山寨币甚至已经突破阻力线,表现相对强势;
• 相比之下,部分涨得较慢的山寨币形态更接近 BTC。
从这个角度来看,ETH 的走势是相对异常的。结合 Crypto10 的表现,可以观察到:BTC 与前九市值山寨币(特别是 ETH)出现了不同步的走势。这或许反映出市场在短期更看好“非大饼资产”的弹性和潜在收益。
这种“山寨异动”其实也属于经典结构:跌得多的品种在反弹时常常会更快、更猛,波动也更剧烈。这是当前在 15min 与 1h 级别上的主要节奏。
📉 从更大周期看
• 日线与 4 小时上,BTC 和 Crypto10 当前并不处于明显下跌趋势中;
• 上一次 BTC 日线级别连续上涨超过 40 天,这次从顶部调整才走了 7 天;
• 当前 BTC 依然在1 小时的震荡区间中试图站稳,而 4 小时周期仍是下行趋势;
• 值得关注的是:市场整体依然对牛市持乐观态度,若 BTC 在阻力位不出现“画门”走势,则山寨很可能快速突破前高,尤其是形态异常的 ETH。
🧭 当前操作策略
• BTC 部分减仓:阻力大致在 10870 附近,15 分钟上涨形态反转时,计划从现有的 6 倍杠杆减仓为 2 倍;不过暂不清仓;
• 若出现 15min 下跌反转,则会加仓做多;
• 若 15min 跌势不反转,将保留底仓观望,再作尾仓处理;
• 偏空情境下,需防范 BTC 出现“画门”式下跌,重启 1h 级别的下行节奏。
🔁 山寨操作思路
• 本轮 15min 三探反弹已错过建仓时机,不准备在这波上涨期间追多;
• 预计在下一波 15min 上涨转跌后,等待再次反转(即“跌转涨”)的机会做右侧交易;
• 止损设置在反转形成的前低附近,控制风险;
• 当前 BTC 与 Crypto10 尚未触及明显阻力位,因此做空需耐心等反转信号;
• 建议空军在阻力位附近观察反转形态后再考虑开空;
多军则可以等待本轮上涨止盈后的小趋势买点,寻找下一次低风险的右侧进场机会。
欢迎大家交流你的策略和判断,尤其是 ETH 和山寨币的节奏分化怎么看?你是选择提前埋伏还是等突破确认?🔍📊
BTC进入震荡收尾,空军式微今天 19:00 左右,BTC 的 15 分钟上升趋势线破位,当时我就在思考接下来的操作。Crypto10 的 15 分钟上升趋势线其实第二个低点比较低,当时也在考虑是否以它为参考,一旦破位就设止损。不过目前我还没有写脚本,也没有接好 API,只能一直盯盘操作。
好在昨天仓位没动,至少让我只需要专注考虑一件事:何时止损?
我现在的止损位设在了 103000,这个位置是短期内的最低位。我不认为在 103000~105000 震荡了这么久之后,还会直接下砸打开新一轮跌势。
如果真要打开下跌空间,我倾向于认为:
要么是 1小时周期先拉一波上涨,然后走“画门式”快速回落;
要么就是出现 非常利空的突发消息,才可能引发这种击穿震荡区间的走势。
复盘昨晚操作 + 当前走势分析与决策思路回想昨晚的操作,我因为没有用程序交易,错过了103500的15分钟金叉,后面看到了在104000买进的5倍仓位,导致止损设置难以接受。
目前crypto10在15分钟上升趋势附近那纠结,crypto10和btc一小时线往死叉方向发展,15分钟跌势明显,比较理想的情况是15分钟趋势反转,重新打开1小时的上升曲线。
更大周期上,由于上升趋势线被击破,周线日线处于跌势打开后,今天决定是否要进一步打开跌幅的日子,看4小时已经得到有力的金叉反转了。
这里走向有三种,我们再评估哪种概率大。
1.走出新的上升趋势,重塑日线,维持周线上涨,也就是牛后期的大幅震荡上行,新高涨的点数不多,但是上下幅度很大。
2.进一步打开跌幅,日线和更大周期下的跌幅调整,直到多军踩踏清仓,空军获利离场才能站稳。在这个角度也看不到比四月末那个6万的位置,这个周线上的上升曲线目前支撑在8万附近,难以想象。
3.小幅震荡下行,没有增加交易量,也没有增加跌的幅度,但就是跌,涨一点点,跌再多一点点。折磨。
目前加仓了6倍杠杆,位置在104200附近,我没有在103500下方看到支撑,所以如果看法是下跌的话,我其实现在做空位置就不错了,止损在上个15分钟的反转开始跌的高位,后面有些日子不会回到这个位置了。但是我现在有多仓,我考虑止盈的话,1小时的死叉没出现又不想止盈。我很犹豫,多空双开吗?你们有什么建议?
我一般比如看1小时趋势,开仓在15min的反转方向上,对应的1小时趋势反转,就止盈止损在15分钟趋势反转的上。
想想应该是存在问题的,看15min和1小时的趋势共振,其实就同时开仓和平仓,那个周期很小,不如等到4小时的周期共振下做操作。
尤其是等到日线和更小周期的所以趋势共振来的更好。
以下是你这段话的整理版本,逻辑更清晰、条理分明,适合发布在 Trading 的中文社区,便于他人理解你的思路并进行讨论:
复盘昨晚操作 + 当前走势分析与决策思路
昨晚操作复盘:
因为没有使用程序交易,错过了 103500 附近 15分钟级别的金叉信号。
后来在 104000 附近买入了 5倍杠杆多仓,但由于点位不够理想,导致止损空间难以接受。
当前市场情况:
• Crypto10 正在15分钟上升趋势线附近震荡纠结
• BTC 和 Crypto10 的 1小时线正向死叉方向演化
• 15分钟跌势明显,短期压力较大
• 比较理想的走势是:15分钟反转形成底部,重新带动1小时上行趋势
更大周期角度来看:
• 上升趋势线已经被击破
• 日线和周线处于跌势打开的过程中
• 今天的走势可能是决定是否进一步打开跌幅的关键节点
• 4小时图上已经出现明显金叉反转信号
三种可能的行情演化路径:
1. 重塑上升趋势,修复日线结构,维持周线多头
○ 类似牛市后期的高波动震荡上涨,虽新高有限,但涨跌幅度都很大
2. 进一步深跌,释放中长期调整需求
○ 多头踩踏、空头获利后才能企稳
○ 如果走这一路径,可能会回测更深位置,比如 Crypto10 的周线支撑在 8万附近,目前难以想象,但需警惕
3. 震荡下行,不放量、不爆跌,但缓慢走低
○ 小幅上涨伴随更大幅度的下跌,持续性消耗多头信心,极其折磨
当前持仓与困惑:
我目前已经在 104200 附近加了 6倍杠杆的多仓。
• 问题在于:我没在 103500 下方看到明显支撑,所以现在若看空,当前的位置其实是个不错的做空点,止损可以放在前一个 15分钟反转起跌点上方
• 但我现在手里是多仓,而 1小时死叉还没出现,止盈又不甘心
• 是否考虑多空双开?很犹豫
• 欢迎你们给点建议
关于操作周期的反思:
我过去的习惯是:
如果看1小时趋势,在 15分钟反转方向上开仓;
如果1小时趋势也反转,就在 15分钟趋势反转处止盈或止损。
但现在看来,这种节奏有问题:
• 15分钟与1小时共振的窗口太小,容易频繁进出
• 更合理的策略是:等待至少4小时级别的趋势共振再操作
• 最理想是出现日线与短周期趋势共振,信号更强、容错更高
总结:
目前市场不确定性较大,持仓方向也让我陷入犹豫。下一步重点关注:
• 15分钟是否反转带动1小时修复
• 若走弱则要考虑是否果断止盈甚至反手做空
• 操作周期上,倾向于从1小时-15分钟切换为4小时-1小时为主轴
欢迎大家交流你们当前的思路或仓位配置,我也在积极优化自己的节奏和策略框架。

BTC 跌破支撑,空仓观望中BTC 跌破支撑,空仓观望中,注意 Crypto10 的关键支撑位
昨晚 BTC 跌破了我昨天提到的支撑位,已止损,目前空仓观望。
这轮下跌中,Crypto10 已经回踩到 4小时级别的上升趋势线支撑,而 BTC 的走势暂时看不太清楚。
值得注意的是,许多前期超涨的山寨币甚至还没回调到 4小时趋势线的支撑位,走势与二饼(ETH)更为接近。
目前:
ETH 离 4小时趋势线破位还有较远距离
山寨虽然跌幅较深,但也还没触及4小时支撑
这主要是因为前期山寨涨得太猛,透支了上涨空间
操作思路:
虽然不太愿意持续空仓观望,但目前确实没有明显的进场时机。我的操作计划是:
✅ 如果今天出现放量下跌:
尝试 低杠杆(2-3倍)做多
在第二/第三支撑位视情况逐步加仓(再加2-3倍)
止损设在放量跌破的最低点,若止损则结束今天的交易,说明对低点判断不准确
✅ 如果今天没有放量跌:
当前已经进入 1小时 MACD 金叉的后半段
若这轮 15分钟级别的下跌不破关键支撑,并出现反转信号
将考虑在 15分钟反转+金叉位置,进场 5倍仓位做多
整体节奏仍偏短线,等待更清晰的信号后才会动作。欢迎交流你的看法。
BTC空仓等待上升结构
昨晚市场共振下跌,大约在凌晨12点,Crypto10指数也正式跌破趋势线。
其实从位置来看,当时是个不错的做空机会,但我在 106500 附近被止损后,价格反弹至 107500,当时没能及时观察和判断,避免了情绪化反手操作。
目前来看:
• BTC 找到了 5.13、5.15 和 5.19 的低点连线支撑位,但 Crypto10 仍未见明显支撑
• BTC 日线 MACD 死叉已打开,中期偏空
• 小周期走势与日线相反:
○ 1小时线处于急跌后的技术性反弹阶段
○ 4小时图呈现插针状态,整体仍是下跌趋势
操作策略思路如下:
• 下跌趋势中,若考虑做空,应等待 1小时线反弹结束后的下跌确认点
• 若尝试做多,只能用极低杠杆尝试,因为若再次回测 104600 附近支撑,止损空间将接近 1500 点
我的决策是:
• 等 15分钟图上出现两次趋势反转确认
• 结合这两个低点画出新的上升趋势线
• 确认支撑结构后再考虑开多仓
• 如果行情上涨过快,在关键阻力位出现剧烈反转,将考虑止盈平多反手做空,止损位设置反转高位,止盈在1小时的金叉
• 若错过入场时机,继续保持空仓观望
欢迎交流不同周期下的节奏切换和操作策略。个人当前以“等待确认 + 控制仓位”为主,尽量避免在大波动中追单。
