欧元EUR趋势与基本交易策略周线复合:周趋势空头,且未超卖(OS),这警告短期⾛势应在未来⼀到两周内维持横盘⾄下⾏,以完成周线低点。(熊)
日线复合:由于日线动能来自超卖区,预示日线低点接近;但鉴于周线动能趋势为空头且尚未超卖,任何反弹都更可能只是周线空头趋势中的 3–4 天左右的修正反弹。(牛)
关键因素:自 7 月⾼点以来形成的震荡区间,属于⼀轮修正结构的⼀部分,(abc)并且可能已经在 11 月完成。即便欧元价格下跌⾄ 低于 11 月低点,也不会否定更⾼时间级别趋势仍为多头,该趋势最终仍应继续向更⾼价位发展。
交易策略建议:周线⾼点应当已经完成,但在周线低点确认之前,下⾏空间应当相对有限。自 7 月⾼点开始的这轮长期震荡修正结构,预计将在周线低点完成后正式结束。
⚠ 短期交易者应以TradingBox信号系统为准!
X-indicator

XAUUSD – 短期趋势线已破,关注买入流动性市场背景
在强劲的冲击性反弹之后,黄金已跌破短期上涨趋势线,发出技术性调整和流动性再平衡阶段的信号。然而,更高时间框架的结构仍然完好,目前的下跌仍被视为修正,而非趋势反转。
从基本面来看,避险需求和谨慎的货币政策展望继续支撑黄金。这使得更深的回调对于机构积累具有吸引力,而不是激进的卖出。
结构与价格行为(H1)
短期看涨趋势线已被突破 → 进入调整阶段。
在这一阶段H1上没有确认看跌的CHoCH。
价格在区间内旋转,目标是下方的流动性池。
多个需求 + 流动性 + H1缺口区域位于当前价格下方。
上方区域仍然是供应 / 流动性卖出区域,可能会出现反应。
关注的关键水平
供应 / 流动性卖出:4,949 – 4,874
中期反应区:4,824
主要买入区:4,755 – 4,729
深度买入区(H1缺口 – 流动性):4,665 – 4,600
交易计划 – MMF风格
主要场景 – 在折扣区买入
寻找以下区域的买入机会:
买入区1:4,755 – 4,729
买入区2:4,665 – 4,600(H1缺口 & 流动性)
仅在明确看涨反应和结构维持后才入场。
避免在价格保持中间区间时过早入场。
上行目标
TP1:4,824
TP2:4,874
TP3:4,949(上方流动性扫荡)
替代方案
如果价格未能达到下方区域并保持在4,824之上,则等待突破和重新测试,在趋势方向重新进入买入头寸。
无效条件
若H1收盘低于4,600,则看涨偏向失效。
保持观望,重新评估整体市场结构。
总结
更广泛的看涨偏向仍然完好,而当前的走势代表了流动性吸收的健康回调。最佳策略是保持耐心——在确认的折扣区买入,而不是追逐价格。

青岚加密课堂:2026年1月22日早间BTC行情分析欢迎来到青岚加密课堂,咱们今天对BTC 四个周期包括消息面进行分析:
1. 数据整合与技术面分析(短、中、长期趋势剖析)
咱们先从短周期看到长周期,把这些K线图揉在一起讲,这样大家更能理解当下市场的全貌。
15分钟 K线(超短线):震荡偏强,但波动剧烈,咱们要非常小心。
最近的45根15分钟K线,价格在88000附近获得支撑后,出现了一波强劲的反弹。MA均线系统在短线形成了一个小小的多头排列,MA5(90136)位于MA10(90008)和MA20(89987)上方,这说明短期的买盘动能是比较足的。MACD指标呢,DIF和DEA两条线刚在零轴上方完成了金叉,MACD柱状图也从负值转正,动能是积极的。RSI指标从低位爬升到了中性偏强的区域,没有超买。
但是呢,这波动可不小呀,前几个小时还从接近90300直接跌到88100附近,然后又迅速拉回90000上方,这说明短线多空博弈非常激烈,市场情绪很不稳定。
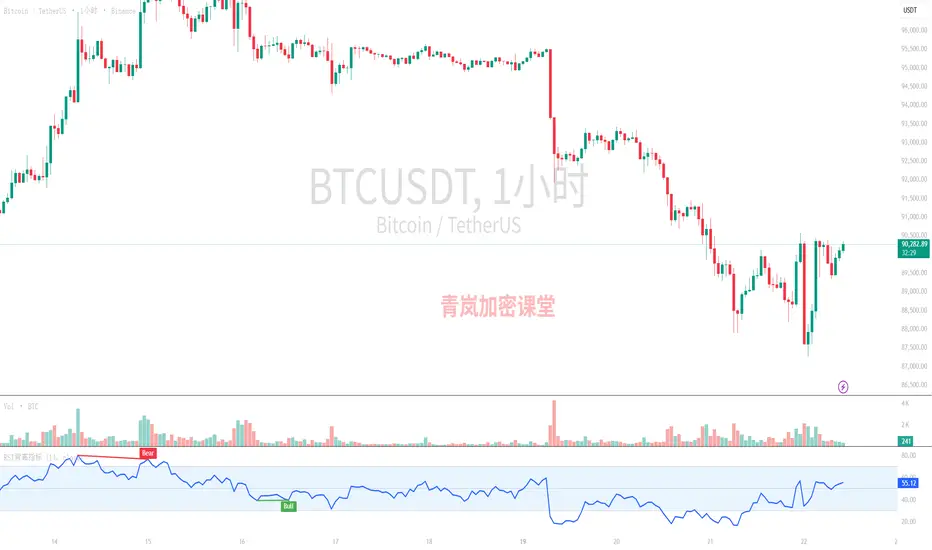
1小时 K线(短线/日内):止跌企稳,尝试反弹,但上方压力不小。
拉长到1小时图,咱们能看到BTC在经历了一波从93000跌到87000的下跌后,近期的K线开始收阳,价格回到了90000附近。MA均线系统虽然整体上还在一个偏空的区域,但MA5(89899)和MA10(89673)已经向上交叉,并且MA5甚至站到了MA20(89370)上方,这是一个积极的信号,说明短线的抛压有所缓解。MACD指标DIF线也刚刚从DEA线下方金叉,MACD柱状图从绿色转为红色,这同样支持了短线反弹的判断。RSI也从极度超卖的16.7回升到了54.93,说明市场情绪有所修复。
不过呀,咱们得留意,虽然止跌了,但反弹的力度还需要进一步观察。前期的下跌积累的套牢盘可不少呢。
4小时 K线(中线):下跌趋势中的修复性反弹,大趋势未改。
再来看4小时图,从97000跌到87000,这个下跌趋势是很明显的。目前价格在87000附近找到支撑后,也有了一定的反弹。MA均线排列上,短期均线(MA5, MA10)仍然在长期均线(MA20)下方缠绕,整体还是偏空头排列,尽管MA5(89829)在MA10(89663)上方,显示短期有支撑,但距离改变整体的空头格局还很远。MACD指标虽然也出现了金叉,但是DIF和DEA都还在零轴下方,并且MACD柱状图虽然转正,但数值非常小,这说明这次反弹的内在动能并不强劲,更像是下跌后的技术性修复。RSI从极度超卖的17.22回升到41.39,但仍在50中轴下方,没有站稳。
1日 K线(长线):明确的下跌趋势,当前处于关键支撑考验期。
日线图上,BTC从接近98000的高点一路跌到87000,这是个非常清晰的下跌趋势。MA均线系统呈现出标准的空头排列,MA5(90888)在MA10(93311)和MA20(92439)的下方(这里MA20比MA10小,有点小问题,但整体均线向下排列的趋势是清晰的)。MACD指标DIF和DEA线虽然还在零轴上方,但是DIF已经大幅度向下死叉DEA线,MACD柱状图是深红色的负值,并且在扩大,这清楚地表明日线级别的下跌动能依然强劲。RSI指标从高位70.05跌破了50中轴,目前在45.81,表明市场已经转为中性偏弱,空头占据主导。
2. 消息面结合与综合判断
咱们再把技术面和消息面结合起来看,会发现很多东西能相互印证呢。
首先,最近的行情波动剧烈,咱们技术面看到的15分钟和1小时的V形反弹,很大程度上是受到【35】和【38】特朗普关于取消关税的言论刺激。这种宏观利好消息,短期内提振了市场风险情绪,导致大量被套的多头平仓,甚至一些空头也开始回补,引发了【14】和【30】高达6.65亿美元甚至10亿美元的杠杆头寸清算,这正是价格剧烈震荡、迅速反弹的直接原因。
但是呢,【3】青岚姐自己的分析 和 【34】投资银行Compass Point的警告 都告诉咱们,虽然短期有反弹,但中期还是要谨慎,尤其是在98000美元(短期持有者平均成本线)这个关键阻力位未能突破前,追涨需谨慎。日线图的MACD死叉和RSI在中轴下方,也印证了【3】日线价格被MA20(92431美元)压制,空头排队的观点,以及【40】比特币创历史新高前,或将再次震荡回调的预测。
此外,【18】和【23】以太坊跌破3000美元,甚至有62.5%概率跌至2500美元的消息,也显示出主流币种整体市场的脆弱和悲观情绪,这对比特币也是一种拖累。【25】日本国债动荡也给全球金融市场带来了不确定性,风险资产自然会受到影响。
当然啦,长期来看,【19】和【22】贝莱德看好以太坊在代币化领域的潜力,以及【27】ARK Invest预测比特币可能达到80万美元,这些都是非常积极的长期叙事,说明数字资产的价值基础在不断加强。【29】Coinbase CEO在达沃斯激辩比特币,也提升了比特币的全球认可度。但这些长期利好,目前还没有转化为短期内改变下跌趋势的强大动能哦。
3. 交易建议与总结
综合来看,BTCUSDT目前正处于一个非常关键的节点。
短期(15分钟/1小时): 咱们看到了一波由消息面驱动的强劲反弹。
关键支撑位: 89500-89800美元。
关键阻力位: 90500-91000美元。
反转形态: 暂未形成明确的短线反转形态,更像是V型反弹后的高位震荡。如果90500-91000附近遇阻回落,可能会走出M顶形态。
做单思路: 短线操作空间小,波动大,不确定性强。如果你是激进的短线交易者,可以尝试在89500附近轻仓做多,目标90500-91000,但要严格止损,破89200立马离场。反之,如果在90500-91000附近出现滞涨或放量下跌,可考虑轻仓短空。
中期(4小时): 处于下跌趋势中的修复性反弹阶段。
关键支撑位: 88000-88500美元(前期低点),下方更强的支撑看87000-87500美元。
关键阻力位: 91000-91500美元(4小时MA均线压制),如果能突破并站稳,上方可看92000-92500美元。
反转形态: 目前的反弹缺乏强劲的底部结构支持,MACD和RSI虽有改善但力度不足。真正的反转需要看到更清晰的W底或头肩底形态,并在成交量的配合下突破重要阻力。
做单思路: 建议谨慎观望为主。如果你想参与,可以在91000-91500美元附近寻找做空机会,止损设置在92000上方。如果价格回调到87000-88000附近能再次获得支撑,并出现放量反弹信号,可以小仓位尝试多单。
长期(1日): 整体大趋势依旧是下跌,目前只是下跌途中的技术性调整。
关键支撑位: 85000-86000美元(消息面和日线K线反复提及的强支撑,也是箱体下沿)。这是咱们的“生命线”,一旦有效跌破,风险会进一步加大。
关键阻力位: 92000-93000美元(日线MA20压制),更强的阻力在94617美元(分析师提及的短期持有者平均成本线)。
反转形态: 日线级别的MACD仍处于死叉状态,RSI在中轴下方,没有看到任何长期反转的迹象。
做单思路: 长期投资者目前应保持观望。不建议在这个位置盲目抄底。在真正改变日线空头趋势,并有效突破94617美元阻力前,任何反弹都可视为逢高减仓或空头布局的机会。如果85000-86000的强支撑能够守住,并在此区域震荡筑底较长时间,再考虑长期布局也不迟。
总结一下呀,咱们的预判是: 短期可能还有冲高动能,但上方阻力重重,冲高后回落的风险很大。中期看,这波反弹更像是下跌趋势中的一个技术性修复,并不是大趋势的反转。长期来看,咱们的大饼还在下跌的通道里,需要时间和更明确的底部信号来确认方向。所以呀,做单思路就是:短线快进快出,中线高空为主,长线耐心等待,咱们宁可错过,也不要犯错!
交易金句: “市场永远是对的,但你的判断力可以让你站在对的那一边,而不是追逐它。”
希望这次分析能帮到大家,咱们下次再见!
-------------------------
受限于图表篇幅和平台合规准则,行情分析有时效性,
最新的分析已更新在我的青岚加密课堂:qinglan.org
或欢迎点击我的头像关注我,通过主页展示的渠道进行更多技术探讨。
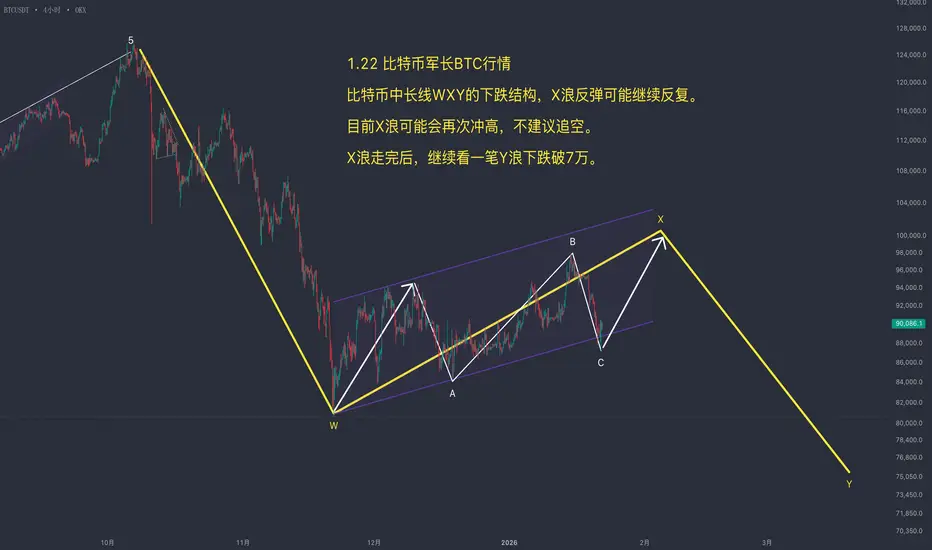
1.22 比特币走势分析:散户一致看空或致行情反复,X浪结构存变数,短期关注反弹做多机会(比特币合约交易)军长1.22 比特币价格今日行情:比特币目前价格在9万附近,自低位有所反弹。市场上普遍看空的情绪反而可能是行情反复的信号。
X浪是否已经终结需要重新审视,当前的下跌存在另一种可能性,即仅为大型X浪中B浪调整的一部分。若市场散户空头过于集中,行情存在向上再探新高以清理空头头寸的可能。
因此,短期不宜盲目追空,反而应关注反弹机会。
开单建议:
鉴于市场情绪与结构的不确定性,操作上应转为灵活。短期内不建议追空,可考虑在关键支撑位置附近,分批布局短线多单,以博弈行情向上反弹、走出潜在新高(即X浪C浪)的可能性。


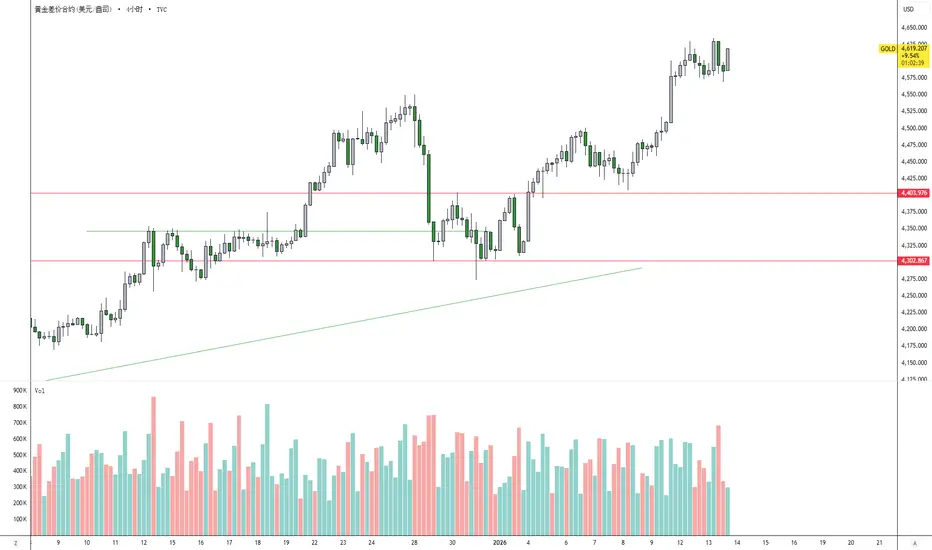
金汇得手:黄金接近4900目标位 今日主空操作 美元指数昨天收长影阳线,今天关注98.8-98.3区间。
黄金昨天日内大涨4888附近,基本到了高盛去年预测的4900目标位。凌晨借助消息面大跌,短期需要回调, 然后再选择方向。所以我们暂时高空为主,昨天低点4755不破暂时不建议追空,小止损博多。早盘4833附近大跌50多美金,4800上方我们找机会再空,如果震荡洗盘,接近日内高点再空。下方如果有效下破4755,大概率还会去本周低点4630甚至这波起涨点的位置4537附近。4755不破,暂时估计就是高位震荡。
操作建议:4800上方或接近日内高点空,接近4755多,其他位置参考上面分析。昨天给到4768附近多,4849空,4888空,4875空。
原油昨天59.2企稳上涨,日线收阳。结合上周周线,今天虽然看多,但是也要防止行情洗盘收阴。所以建议接近61.3不破先空,强阻力62附近,下方接近59.5再多。分析仅供参考,实盘为准。

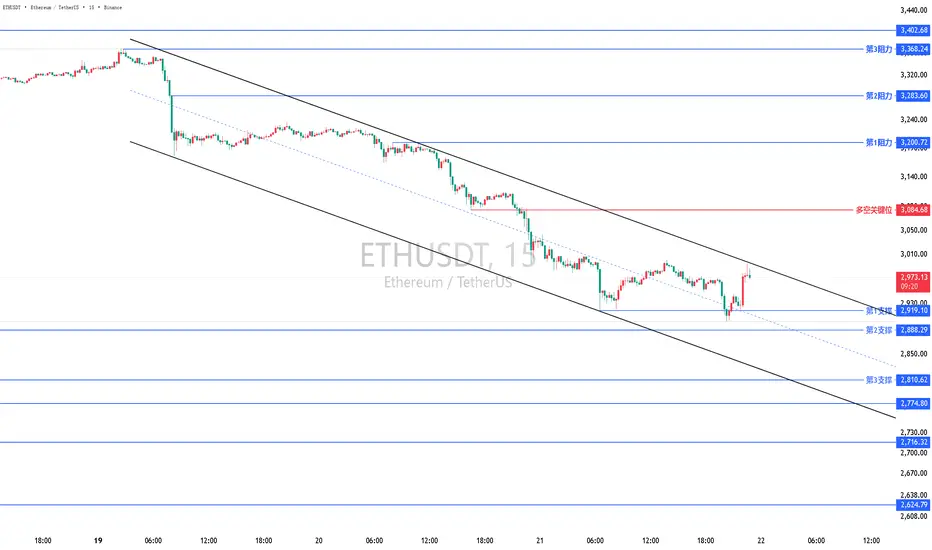
(有梦分析)二饼 当前行情多空关键位之下偏空,以回调看空为主或背靠下跌通道高抛低吸为主,下破看空,突破看多。二饼当前行情多空关键位之下偏空,以回调看空为主或背靠下跌通道高抛低吸为主,下破看空,突破看多。


(有梦分析)周三黄金计划多空关键位之上偏多,以回调看多为主,或背靠上涨通道,以高抛低吸为主,突破看多下破看空为辅,周三黄金计划多空关键位之上偏多,以回调看多为主,或背靠上涨通道,以高抛低吸为主,突破看多下破看空为辅,每一次进场必须要有信号而且背靠关键位。

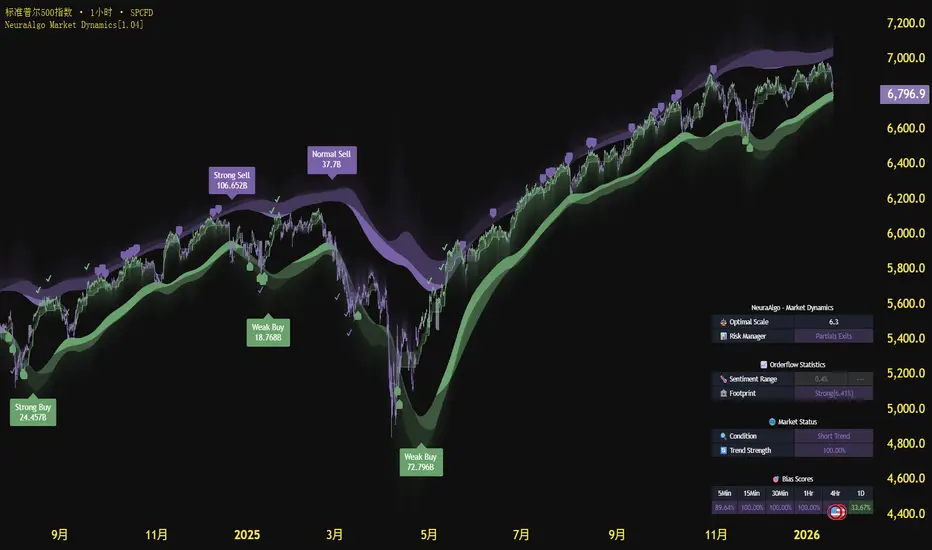
标普500 S&P行情大局以及趋势分析标普 500 指数(S&P)⽬前正处在⾃ 2009 年低点以来⽜市多头趋势的最后阶段,随后很可能进其持续时间与价格幅度都将超过⼊⼀轮熊市与经济衰退, 2009 年低点以来的任何⼀次。2026 年上半年被视为完成最终顶部的理想时间窗⼜。当前⾏情在未来⼏周内,创新⾼的概率较⾼。
⚠更多交易分析及工具可以关注 NeuraAlgo 进行查看!

原油 CRUDE 趋势与基本交易策略周线复合:周线未处于超买区(OB),这意味着趋势在未来⾄少⼀到两周内应整体维持多头。
日线复合:日线未处于超卖区(OS),这意味着在日线低点完成之前,⾄少还需要⼀到两天的整体空头⾛势。
关键因素:如果趋势如预期为多头,原油不应收盘跌破 12 月 23 日的小级别摆动⾼点收盘价。如果发⽣这种情况,则暗示趋势不应如预期那样继续维持多头。
交易策略建议:多头交易策略应以“收盘价跌破12 月 23 日的小级别摆动⾼点收盘价”为⽌损。
⚠ 短期交易者应以TradingBox信号系统为准!

特朗普达沃斯警告使黄金保持强劲上升趋势市场背景(新闻 → 流动)
特朗普在达沃斯的评论,包括对格陵兰的重新威胁和压力,已在亚洲时段加剧了地缘政治不确定性。
市场以经典的避险模式作出反应:
美元因政治不确定性而走弱
股市犹豫不决,风险偏好减弱
避险资金流入黄金,推动动能上升
黄金不是在投机中移动——它是在对寻求保护的资本作出反应。
技术结构(H1 – SMC)
整体结构保持看涨,多个BOS确认
价格在一个明确的上升通道内趋势
最近的回调尊重了看涨FVG,显示出强劲需求
目前阶段没有结构下方的看跌接受
➡️ FVG被尊重 → 继续保持
关键决策区域
上方FVG:4,765.425
中间支撑:4,727.188
当前冲高:4,883.900
这些是反应区,而不是追逐水平。
情景(如果 – 那么)
主要情景 – 趋势延续
如果价格保持在4,765.425以上
看涨结构保持完整
黄金可以继续向更高的通道阻力推进
替代情景 – 技术回调
如果价格失守4,765.425
可能回调至4,727.188以重新平衡
只有明确的H1收盘低于4,727.188才会削弱看涨偏见
总结
地缘政治言论正在加速波动,但结构仍然主导叙述。
黄金不是情绪化反应——
它是在定价风险。


XAUUSD H1 – 流动性抓取完成,关注买入回调市场背景
黄金刚刚完成了一次强劲的冲击性反弹,留下多个流动性口袋和不平衡区。当前的回调具有技术性质,作为扩张后的再平衡阶段,而不是趋势反转。
从宏观角度来看,避险需求和谨慎的美联储前景继续支持黄金,使整体偏向上涨。
技术结构(H1 – MMF)
市场结构依然看涨,形成更高的高点和更高的低点。
最近的抛售是对之前需求区的流动性抢夺。
此阶段没有确认的看跌CHoCH。
价格仍然保持在主要的H1缺口流动性区域之上。
交易计划 – MMF 风格
主要情景 – 跟随趋势买入
偏向于在回调中寻找买入机会:
买入区域 1:4,759 – 4,729
买入区域 2(深度):4,669 – 4,600
只有在明确的看涨反应和结构保持后执行买入。
避免在高价位时产生FOMO。
上涨目标
TP1:4,817
TP2:4,892
TP3:4,898(流动性扫荡区)
备选情景
如果价格未能维持在4,729之上,并深度扫荡至H1缺口区域,则在重新积累信号出现后再考虑买入。
失效条件
若H1收盘低于4,600,便失效看涨布局,需要全面重新评估结构。
总结
整体趋势依然看涨。当前的走势是向流动性回调,为高质量的逢低买入机会提供了可能性。耐心和确认是关键——让价格主动找上你。

青岚加密课堂:2026年1月21日早间BTC行情分析欢迎来到青岚加密课堂,咱们今天对BTC 四个周期包括消息面进行分析:
咱们从短到长,结合消息面,一起捋一捋现在的市场是个什么情况,好不好?
1. 短期视角(15分钟 & 1小时):瀑布后的挣扎与喘息
从15分钟和1小时的K线来看,咱们的BTC呀,刚刚经历了一波不小的“瀑布”行情。特别是在今天(1月21日)的早盘,价格一度从9万多跌到了8.8万美元附近,这让不少朋友都心惊胆战了吧?
* 15分钟图:最近43根K线显示,在大幅下跌之后,短线市场开始尝试企稳反弹了。MA5(89467)已经上穿MA10(89309)和MA20(89089),形成了一个小小的多头排列,这是一个积极的信号哦!MACD指标也从负轴下方金叉向上,MACD柱状图由负转正,动能柱持续放大(217.71),这说明短线买盘力量正在增强。RSI目前是57.03,处于一个相对中性的位置,还有一些上行空间。
* 1小时图:同样是最近43根K线,虽然整体趋势仍然偏空,但最新的几根K线也显示出止跌企稳的迹象。MA5(89185)也已经上穿了MA10(89180),但它们仍然被MA20(89911)压在下方,这意味着短期的反弹力量还没有强大到能扭转更小的中期趋势。MACD也出现了金叉(DIF在-770.66,DEA在-858.93,DIF>DEA),MACD柱状图也从负轴下方开始向上发展(176.54),这是典型的超跌反弹信号。RSI是37.69,依然处于超卖区域,说明市场情绪依然低迷,但技术上存在反弹需求。
短期总结:咱们的BTC在经历了一波急跌之后,短线正在尝试技术性反弹,有可能是“青岚姐”在消息面提到的“下跌趋势中的技术反弹”哦。但这个反弹能否持续,还得打个问号,因为大周期还是空头占优。
短期关键支撑与阻力:
* 支撑位:最近的支撑在89000美元附近,再往下就是88250-88000美元这个重要区间了。
* 阻力位:向上看,短线阻力在89700-90000美元,这里也是一个心理关口。再往上,91000-91200美元是强阻力。
2. 中期视角(4小时):疲软的底部与超卖警示
* 4小时图:最近43根K线展现的是一个非常明确的下跌趋势,从1月18号开始,币价就一路狂泻,从95000美元上方跌到了目前的8.9万美元附近。K线形态上,大阴线频现,空头力量非常强势。MA均线呈完美的空头排列(MA5 < MA10 < MA20),价格都在所有均线下方运行,这表明中期趋势非常疲软。MACD指标DIF(-1393.45)和DEA(-893.45)都在零轴下方运行,并且MACD柱状图(-999.99)还在向下扩散,这说明中期下跌动能非常强劲,没有止跌的迹象。但RSI指标却低至28.52,这可是严重的超卖区域了!这通常意味着市场跌得有点狠了,随时可能出现一波像样的反弹。
中期总结:尽管中期趋势非常悲观,但技术指标已经发出强烈的超卖信号,预示着一波像样的反弹或许就在眼前。不过,这仍然只是反弹,离真正的趋势反转还有距离哦。
中期关键支撑与阻力:
* 支撑位:88000美元是重要的心理和技术支撑,如果这里失守,下方就没有很强的短期支撑了。
* 阻力位:90800美元(4H MA10附近)和92000-92500美元(4H MA20附近以及前期下跌平台)是重要的阻力区域。
3. 长期视角(1日):熊影笼罩,但希望犹存?
* 1日图:最近43根K线显示,比特币在1月初短暂冲高到9.7万美元后,便开始了持续的回调。特别是最近几天,大阴线频现,直接跌破了9万美元的关键心理关口,甚至一度触及8.8万美元。MA均线也转为空头排列(MA5 < MA10 < MA20),价格被均线死死压制,这是非常典型的下跌趋势。MACD指标更是给出了一个明确的“死叉”信号(DIF 451.49 < DEA 1059.01),MACD柱状图(-1215.03)持续向下放大,这简直是给长期空头敲响了胜利的战鼓。RSI目前是43.26,虽然跌了不少,但离极度超卖还有距离。
长期总结:日线级别来看,BTC已经确认进入下跌趋势,空头掌控着大局。不过,最新的K线是一根小阳线,勉强守住了8.8万美元附近,这可能是超跌后的短暂抵抗,也可能是多头在积蓄力量。
长期关键支撑与阻力:
* 支撑位:目前强支撑就在88000美元附近,跌破这个位置,那么下方可能就要看到86000美元甚至更低了。
* 阻力位:上方阻力非常明显,首先是91800美元(日线MA5),再往上就是93400美元(日线MA10)和92400美元(日线MA20)附近。
4. 消息面整合:暴风雨中的避险与长远布局
咱们的消息面今天可真不少,而且大部分都指向了同一个方向——“避险情绪”和“市场恐慌”。
* 利空消息主导:多条消息都提到了比特币失守9万甚至8.8万美元,以太坊也跌破3000美元,市场情绪指数跌到“极度恐惧”(新闻 、 、 )。全球宏观经济背景也不容乐观,美股暴跌,贸易紧张局势升级(新闻 、 、 ),黄金白银创新高,大家都跑去避险了,加密货币这种高风险资产自然就被抛售了(新闻 、 )。更重要的是,比特币算力骤降15%,矿工盈利恶化,甚至出现“投降信号”(新闻 ),这可是比特币基本面的一大打击呀!青岚姐在早报和午报中也明确指出市场笼罩在“避险潮”和“失血行情”中,并且日线级别空头占优(新闻 、 )。
* 利好消息暗藏:虽然短期利空缠绕,但也有一些值得关注的积极信号。比如,稳定币市值创历史新高(3070亿美元),这就像是市场里攒了一大笔“闲置”资金,随时准备入场,预示着潜在的触底和流动性注入(新闻 )。还有分析师提到比特币出现了“历史性超卖信号”,认为新一轮牛市可能蓄势待发,甚至目标10.7万美元(新闻 、 )。此外,一些机构在持续布局比特币(指数年金问世,新闻 、 ),现货买家也转为积极(新闻 ),这都显示出对加密货币长期价值的认可。
综合预判与做单思路:
好啦,综合咱们的技术面和消息面,我的预判是:
* 短期(15分钟-1小时):目前的短线反弹,更像是瀑布后的技术性修复,在一个强势下跌趋势中的震荡偏上涨。大家要注意,这大概率是个诱多陷阱,因为更长周期的压制仍然非常强劲。
* 中期(4小时):仍然处于下跌趋势中,并且动能强大。虽然RSI极度超卖,可能会带来一波幅度较大的反弹,但这种反弹往往是下跌中继。
* 长期(1日):毫无疑问,日线级别已经进入了下跌趋势。宏观环境和基本面(矿工)都在给比特币施压。虽然有长期看涨的声音和潜在的“干粉”资金,但这些都不能在短期内改变下跌的格局。
做单思路:
咱们现在啊,首要任务就是风控!
1. 短线交易者:可以尝试在目前的支撑位(比如89000-89400美元区间)附近,轻仓参与技术性反弹的多单,目标位设置在90000美元附近,止损务必放在88000美元下方,严格执行。记住,这是火中取栗,一旦反弹无力,就要果断离场。也可以等待反弹到90000-91000美元阻力位附近,观察是否有滞涨信号,考虑布局空单,止损放在阻力位上方。
2. 中长线投资者:目前不建议盲目抄底。日线级别的MACD死叉和空头排列,再加上矿工投降信号和宏观利空,都预示着市场可能会有更深度的调整。咱们可以耐心等待,要么等到更强劲的底部形态出现(比如日线出现金叉、价格站稳关键均线),要么等待价格跌到86000美元下方甚至更低,并且出现放量止跌的信号,再考虑分批建仓。
总之呀,现在市场情绪非常脆弱,波动也会比较大。咱们做交易,一定要保持冷静,不要被短期的K线涨跌影响了心态。就像青岚姐常说的:
“潮涨潮落皆是常态,唯有耐心与纪律,才是穿越牛熊的罗盘。”
-------------------------
受限于图表篇幅和平台合规准则,行情分析有时效性,最新的分析已更新在我的青岚加密课堂:qinglan.org 或欢迎点击我的头像关注我,通过主页展示的渠道进行更多技术探讨。


智者生存:黄金持续创造历史,市场目标在哪交易小Tips:交易只要解决两个问题:先解决方向问题,再解决入场问题
消息方面:
昨日黄鱼盘中最高触及 4634,刷新历史。随后快速回调,收盘稳定于 4586-4591区间,日内呈现冲高回落形态。美通胀数据不及预期,以及持续的地缘政治和经济不确定性推动了避险需求。但圣路易斯联储主席穆萨莱姆表态“通胀未达2%目标前无降息必要”,短期降息预期降温。美元反弹提高了非美投资者的黄金持有成本,成为压制金价的主因。
日线表现上,黄鱼延续受阻,当前行情处于上涨趋势上行受阻,若想延续趋势就需要吸收掉此次箜头,反之,若此次箜头表现强劲,则后市需要更多时间去“多空消耗”。当前表现,中期思路需要等待观察价格表现,即上方箜头压力是否强势是否能延续,因为如果箜头保持强势,就不符合上涨趋势需要的条件。短期交易倾向震荡为主,当前行情维持4560-4630区间震荡,关注更多的价格表现抉择