黄金分析 2025年9月12日1. 基本面分析:
a) 经济:
美元(USD):
美元在窄幅区间震荡,没有出现强势突破。投资者预期美联储未来几个季度可能降息,削弱了美元对黄金的压制力。然而,当 SPDR 出现卖盘时,美元走弱对黄金的支撑作用将明显减弱。
美国股市:
美国股市继续保持 risk-on 状态,因税收政策预期及投机资金回流推动上涨。这对黄金形成短期压力,使其更容易出现深度回调。
美联储(FED):
美联储保持“数据导向”立场,但如果通胀持续下降,将倾向于降息。这对黄金的中期走势有利,但在 ETF 继续减仓的情况下,短期支撑不足以阻止金价下跌。
特朗普(TRUMP):
特朗普政府优先推行减税政策、支持企业 → 利好股市。
相反,黄金承压,除非出现新的地缘政治风险。
与中国的贸易摩擦政策仍构成长期潜在风险,对黄金具备长期支撑性。
黄金 ETF – SPDR:
SPDR 连续两天小幅减仓,机构买盘减弱。
→ 这是一个重要信号,使黄金更容易失去支撑,增加图表中“情境02”发生的概率。
b) 政治:
红海、中东及乌克兰局势仍不稳定。虽然尚未引发重大市场震荡,但这些风险维持着潜在的 risk-off 氛围,任何坏消息都可能导致金价迅速拉升。
c) 市场情绪:
当前市场情绪偏中性至看跌,黄金更容易进入调整结构。投资者正等待经济与政治方面更明确的信号。
2. 技术面分析:
15分钟周期:
价格贴近上升趋势线运行,但卖压占据主导。
RSI 位于短期中性区域 → 可能出现小幅反弹。
市场结构倾向于在卖盘持续时跌破 4.174 – 4.163 支撑区。
两大主要情境:
01 – 技术性反弹后继续下跌至 4.193,若该位不破将出现反弹。
02 – 若市场强势 risk-on,则可能深跌进入主力吸筹区:
• 跌破 4.174 后,目标看向:
4.147
4.120
→ 此为今日最佳买入区。
阻力位: 4.219 – 4.239 – 4.263
支撑位: 4.174 – 4.163 – 4.120
3. 前一交易日市场(8/12/25):
黄金按预期维持窄幅震荡。
因缺乏重要消息推动,未出现强势上涨。
SPDR 小幅卖出,但黄金仍保持整体上升结构。
成交量偏低 → 市场容易出现噪音及假突破。
4. 今日交易策略(8/12/25):
🪙 SELL XAUUSD | 4221 – 4219
SL:4225
TP1:4213
TP2:4207
🪙 BUY XAUUSD | 4160 – 4162
SL:4156
TP1:4168
TP2:4174
X-indicator


(有梦分析)当前行情三角震荡收敛,多空关键位之下偏空,背靠上阻力线和支撑线高抛低吸为主,突破看多下破看空为辅。当前行情三角震荡收敛,多空关键位之下偏空,背靠上阻力线和支撑线高抛低吸为主,突破看多下破看空为辅。

(有梦分析)周二黄金计划,多空关键位之上偏多,以回调看多为主或背靠箱体震荡以高抛低吸为主,下破看空上破看多为辅。周二黄金计划,多空关键位之上偏多,以回调看多为主或背靠箱体震荡以高抛低吸为主,下破看空上破看多为辅。

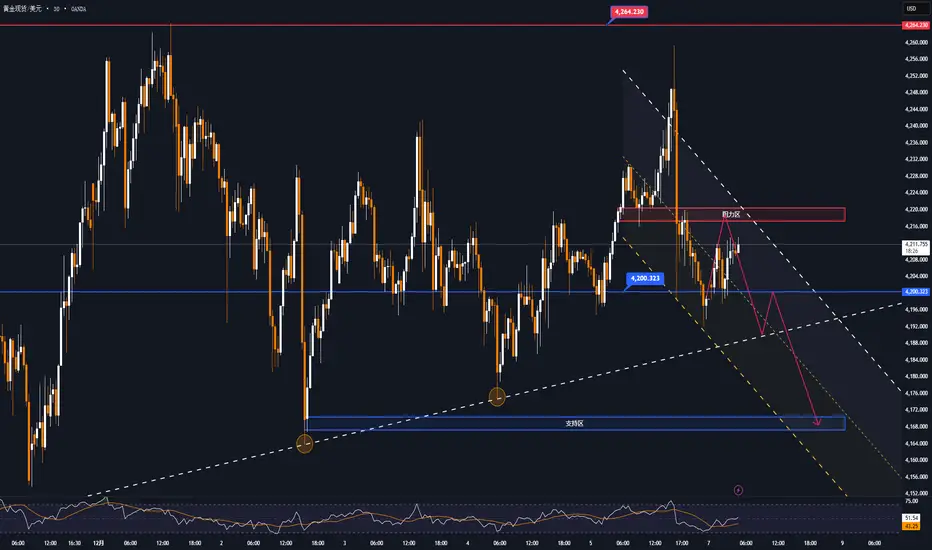
黄金市场分析与评论 - [12月8日-12月12日]本周初,国际黄金 OANDA:XAUUSD 价格从 4,264 美元/盎司下跌至 4,164 美元/盎司,随后反弹至 4,259 美元/盎司,之后再次回落,并以 4,198 美元/盎司收盘。
国际金价继续上涨,在 4,200 美元/盎司附近震荡。由于美国通胀相对稳定,加上数据显示美国劳动力市场明显放缓,这重新点燃了市场对美联储在下周会议上降息的预期。根据 CME 的 FedWatch 工具,市场再次押注美联储下周继续降息的概率接近 90%。
许多专家认为,美联储在下周会议上的降息可能对金价影响不大,因为这一预期已在近期交易中被市场消化。然而,如果美联储释放的信号显示 2026 年可能会比 9 月会议公布的指引进行更多降息,将会为金价提供更强劲的上行动力。
除了降息压力外,美国还面临巨大的财政赤字和庞大的公共债务,这意味着美国将不得不向经济注入大量资金。这不仅可能推升通胀,还可能给美国经济乃至全球经济带来潜在的不稳定风险。
总体来看,黄金未来的走势将取决于美联储是否继续放松货币政策,以及宏观经济条件是否出现变化,例如经济增长疲弱或地缘政治风险上升。若要创下历史新高,金价需要多重因素共同推动,包括美联储更激进的降息、美元持续走弱、更强的避险需求,尤其是各国央行加大购金力度。
除了美联储的货币政策会议外,澳大利亚储备银行、加拿大央行和瑞士国家银行也将公布利率决议。市场普遍预计这三家央行将维持利率不变。
📌 技术面来看,黄金在 H4 图上呈现区间收窄的横盘走势,阻力位在 4,264 一线。若突破该位置,将推动金价上探 4,380。一旦金价跌破 4,200,下周可能仅在 4,100–4,265 美元/盎司区间波动。
SELL XAUUSD 价格 4222 – 4220 ⚡️
↠↠ 止损 4226
BUY XAUUSD 价格 4168 – 4170 ⚡️
↠↠ 止损 4164
阿里巴巴回调至关键支撑区在 9 月创下新高后,阿里巴巴的股价在过去数月进入整理阶段。目前价格已回落至一个值得关注的技术区域——此前的突破压力位如今转化为支撑,同时也临近 200 日移动平均线。与此同时,11 月底的交易更新优于市场预期,并显示 AI、云业务以及中国电商板块持续取得进展。
股价收窄、基本面扩张,这次回调是否正在酝酿新的机会?让我们进一步观察。
AI 引擎持续推动增长
阿里巴巴于 11 月 25 日发布了强劲更新。若不计入高鑫零售与银泰,总收入同比增长 15%。云智能收入同比增长 34%,AI 相关产品收入更连续第九个季度保持三位数增长。随着阿里巴巴全栈 AI 的采用度不断提高,AI 服务目前已占对外云收入的 20% 以上。
中国电商业务同样有所改善。客户管理收入(CMR)同比增长 10%,反映用户参与度与交易活动增强。即时零售(Quick Commerce)表现突出,收入同比增长 60%,并在订单结构、履约效率与单位经济性方面较年初显著提升。管理层也确认,目前增加投资旨在构建长期领导地位,尽管短期内自由现金流承压。
压缩走势来到关键决策点
从技术面来看,阿里巴巴股价持续在收敛结构内盘整。来自秋季高点的下降趋势线构成短线压力,而夏季的突破区间目前仍起到支撑作用。价格依旧处于 50 日均线下方,显示市场正等待新的催化因素。
回顾过去一年,股价多次在窄幅区间内整理后,最终顺势突破向上。目前的停顿走势与此前情况类似。若价格能有效突破下降趋势线,将意味着多头动能重新回归;若关键支撑失守,则可能引发股价进一步回调至 200 日均线附近的长期底部区域。
阿里巴巴股价虽持续压缩,但企业基本面仍在扩张。当这两股力量最终交汇,有可能带来更具延续性的走势。
BABA 日线图
过往表现并非未来结果的可靠指标
免责声明
本内容仅供信息与学习用途,不构成投资建议,亦未考虑任何投资者的个人财务状况或投资目标。任何与过往表现相关的信息,都不构成未来表现的可靠指引。社交媒体渠道不适用于英国居民。
差价合约和金融衍生品为复杂工具,由于杠杆作用,存在快速亏损的高风险。**85.24% 的散户投资者账户在与本提供商交易差价合约或金融衍生品时遭受亏损。**在交易前,您应确保充分了解这些产品的运作方式,并评估自己是否能够承担高风险亏损。

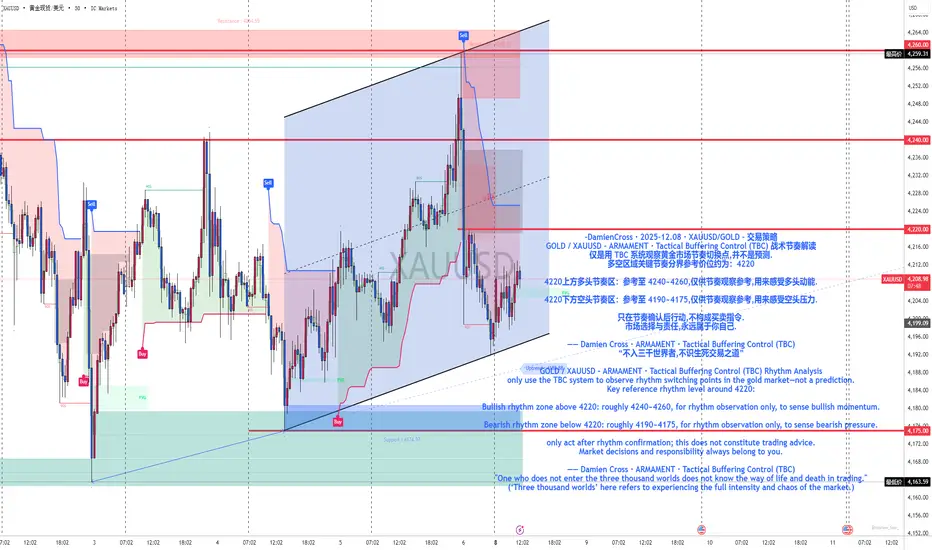
-DamienCross · 2025-12.09 · XAUUSD/GOLD - 交易策略-DamienCross · 2025-12.09 · XAUUSD/GOLD - 交易策略
GOLD / XAUUSD – ARMAMENT · Tactical Buffering Control (TBC) 战术节奏解读
仅是用 TBC 系统观察黄金市场节奏切换点,并不是预测.
多空区域关键节奏分界参考价位约为:4210
4210上方多头节奏区:参考至 4220~4240,仅供节奏观察参考,用来感受多头动能.
4210下方空头节奏区:参考至 4185~4160,仅供节奏观察参考,用来感受空头压力.
只在节奏确认后行动,不构成买卖指令.
市场选择与责任,永远属于你自己.
—— Damien Cross · ARMAMENT · Tactical Buffering Control (TBC)
“不入三千世界者,不识生死交易之道”
GOLD / XAUUSD – ARMAMENT · Tactical Buffering Control (TBC) Rhythm Analysis
only use the TBC system to observe rhythm switching points in the gold market—not a prediction.
Key reference rhythm level around 4210:
Bullish rhythm zone above 4210: roughly 4220~4240, for rhythm observation only, to sense bullish momentum.
Bearish rhythm zone below 4210: roughly 4185~4160, for rhythm observation only, to sense bearish pressure.
only act after rhythm confirmation; this does not constitute trading advice.
Market decisions and responsibility always belong to you.
—— Damien Cross · ARMAMENT · Tactical Buffering Control (TBC)
"One who does not enter the three thousand worlds does not know the way of life and death in trading."
(‘Three thousand worlds’ here refers to experiencing the full intensity and chaos of the market.)

欧元EUR趋势与基本交易策略周线复合:尚未进⼊超买区。这通常意味着未来 2–3 周趋势仍应整体多头,直到形成⼀个周线⾼点。(牛)
日线复合:日线⾼点应已完成,但由于周全部动能周期都为多头且未超买,任何日线级别的下跌都应只是横盘或小幅修正,并且幅度在周线多头趋势之中。
关键因素:11 月初的低点处于⼀个⼏乎理想的技术位置,⾜以构成⼀个 周线低点,甚⾄可能是月低点。完成自 7 月⾼点以来的⼀轮修正。
交易策略建议:不跌破 11/21 的小型摆动低点(日线收盘价) 的前提下,应为做多策略,顺着⼤概率的多头⽅向,最终涨破 2025 年 9 月⾼点之上更⾼的位置。
⚠ 短期交易者应以TradingBox信号系统为准!

12.09以太坊价格今日行情:以太坊目前处于震荡行情中的e浪,e浪完成后是下一笔上涨(以太坊合约交易)12.9 ETH走势分析军长
以太下跌看WXY结构。目前还处于W浪下跌。
小级别白线反弹ABC结构,目前处于B浪三角调整,后续还有一笔C浪上涨。
开单建议:靠近3000做多。

12.9 比特币走势分析:比特币继续看震荡上行,预计在三角下轨89-88区间布多,做好破位加一次仓的预期即可(比特币合约交易)军12.9 比特币价格今日行情:比特币目前在91,000左右,最近这几天的行情可以说是震荡反复、结构复杂。从80,537这一笔上涨以来,比特币整体依然是震荡上行的结构,这个方向没有任何改变,只是中间的震荡形态变得极为繁琐。
从目前的结构来看,行情大概率是在走一个震荡三角,三角震荡完成之后,会接一笔与80,537那一笔同级别的新一轮上涨。
三角形中间整体是ABCDE五浪,目前处在最后一段E浪当中。E浪走完,就是新一笔的上涨。但是我们仍然要防一个情况,就是三角下轨的破位。如果E浪往下踩得更深,出现下轨破位,那我们要在下轨附近做好一次加仓多单的准备。
综上分析,C4浪还有一笔大幅拉升上涨的观点未变,中间震荡结构形成了三角震荡区,目前处于最后一笔e浪震荡中,完成后是C浪上涨。预计在三角下轨89-88区间布多,做好破位加一次仓的预期即可。

金汇得手:黄金依旧震荡洗盘 继续高空低多操作 美元指数昨天收阳,今天关注98.5-99区间。
黄金昨天依旧是震荡洗盘,日线再次收十字星。今天走势依旧不明朗,周四凌晨利率决议,个人倾向这两天区间震荡为主,所以操作上高抛低吸。目前阻力4195附近,也是日内多空分水,也是趋势线下破回抽确认。如果今天受阻,还会去4185或昨天低点附近,强支撑4147附近,触及都可以多。如果行情站稳4195,再看10-20美金,强阻力4230上方,触及可以再空。
操作建议:早盘关注4195一线反应,先涨接近4205附近或10上方找机会空,先跌4184或接近昨天低点多。昨天给到4218空,4211空,4174附近多。
原油也是震荡洗盘,昨天收破位阴线,今天反弹59.6附近空,走弱的话59.2附近先空,目标58.2附近破位看57.7,然后反手多。分析仅供参考,实盘为准。

BTC 后市走势_2025.12.07没有新观点,是对 12.03 复盘观点 的细化及纠偏
12.03 观点中的 TP1-$90700 TP2-$88800 均已到达
目前已在 ~$88000 附近见底,进入行情第二阶段,暂时看到 ~97000 附近


BTC短线反弹持续今日盘面:交易量持续下降,周末在87-92K反复震荡洗盘,短线有延续反弹趋势。
宏观面:降息利好消化殆尽,美联储缩表,可能开启RMP,整体放水成谨慎状态,日元加息,多钱美债平仓压力加剧,短期可能出现资金回流,加上本轮暴跌,机构和新散户对BTC高风险高波动性防范意识加剧,短期新资金入场恐难实现。
技术面:BTC在88.5K出现明显支撑反应,回踩获取流动性确认支撑后开启上涨,本轮下跌反弹有延续趋势,日线各项技术指标均看涨。
个人仓位情况:合约,中长线空单继续持有,止损下移94K,继续博弈大周期空头延续;短线小仓位博智短多止损88K、博弈反弹至99K大周期上升趋势线。现货不加仓,祝小伙伴们好运。
以上均为个人判断,不构成投资建议。
减持学习,计划交易,知行合一。感谢关注。

目前bitcoin还是在走一个反弹从技术分析上还没有出现反转回到牛市的结构
我更倾向于反弹到一个周线阻力后会继续下跌
当然如果日线突破EMA200并且回踩成功的话
趋势就重新回到多头了
没有突破EMA200则反弹结束后继续破更低的低点


-DamienCross · 2025-12.08 · XAUUSD/GOLD - 交易策略-DamienCross · 2025-12.08 · XAUUSD/GOLD - 交易策略
GOLD / XAUUSD – ARMAMENT · Tactical Buffering Control (TBC) 战术节奏解读
仅是用 TBC 系统观察黄金市场节奏切换点,并不是预测.
多空区域关键节奏分界参考价位约为:4220
4220上方多头节奏区:参考至 4240~4260,仅供节奏观察参考,用来感受多头动能.
4220下方空头节奏区:参考至 4190~4175,仅供节奏观察参考,用来感受空头压力.
只在节奏确认后行动,不构成买卖指令.
市场选择与责任,永远属于你自己.
—— Damien Cross · ARMAMENT · Tactical Buffering Control (TBC)
“不入三千世界者,不识生死交易之道”
GOLD / XAUUSD – ARMAMENT · Tactical Buffering Control (TBC) Rhythm Analysis
only use the TBC system to observe rhythm switching points in the gold market—not a prediction.
Key reference rhythm level around 4220:
Bullish rhythm zone above 4220: roughly 4240~4260, for rhythm observation only, to sense bullish momentum.
Bearish rhythm zone below 4220: roughly 4190~4175, for rhythm observation only, to sense bearish pressure.
only act after rhythm confirmation; this does not constitute trading advice.
Market decisions and responsibility always belong to you.
—— Damien Cross · ARMAMENT · Tactical Buffering Control (TBC)
"One who does not enter the three thousand worlds does not know the way of life and death in trading."
(‘Three thousand worlds’ here refers to experiencing the full intensity and chaos of the market.)
比特币趋势与交易策略周线复合:周线还未超买未来2-3周整体为横盘或上涨⾏情。(牛)
日线复合:日⾼点应该已经完成,日线整体趋势横盘⾄下跌3-4天。(熊)
关键因素:两周前周动能出现多头反转后,价格未能延续形成冲顶式上涨,这发出了警告:在确认周线低点之前,很可能还会再创⼀个新低,当前形态结构提示比特币上周完成了⼀个小级别的ABC:开始W.4 修正,但这⼀判断需要价格日收盘跌破 12 月 1 日收盘价才能确认。
交易策略建议:多头仓位的⽌损应设在不低于85,760即 12/1 的小级别摆动低点收盘价处。
⚠ 短期交易者应以TradingBox信号系统为准!

12.8 比特币走势分析:比特币目前计划9万上方短空到87左右止盈,然后在87-86区间转多做最后一笔C浪上涨到97附近(比特币 12.8 比特币价格今日行情:比特币目前在90,018左右的位置,今天给大家的第一个操作建议非常明确——在这里开一个短空。记住,这里是做短空,不是大级别的趋势空。我们现在做的这笔短空,就是空它这一笔小级别的下探。等它下探完成以后,再去做它下一轮的c浪反弹,也就是说下一笔反抽我们将会做多。
再来看昨天晚上的细节结构。昨晚行情突然拉起一笔非常快速的反弹,然后又迅速结束,这种结构在浪型里面通常代表小级别的 c浪。也就是说从低位反弹这边属于一个小级别的ABC结构,而前面从94,000跌下来,也同样是一个ABC的结构。连续两段都是三浪,那意味着接下来极有可能走第三段三浪,下跌的小级别c浪就在眼前。
综上分析,目前计划短空到87左右止盈,然后在87-86区间转多做最后一笔C浪上涨到97附近。

BTC每周预判1208:短期止跌,逢低做多BTC上周在预判的支撑附近大反弹,压力附近回落,符合预期。
暂时看,波段调整空间已经到位,时间还不够,
本周支撑8.5万附近,压力9.4万附近。
短期下跌动能衰减,跌多了分批接多做多,反弹到压力附近高抛,等回落再接。
ETH走势同BTC。

(有梦分析)周一黄金计划,多空关键位之下偏空,以回调看空为主或背靠下方趋势线支撑不破回调看多为主,下破看空为辅。周一黄金计划,多空关键位之下偏空,以回调看空为主或背靠下方趋势线支撑不破回调看多为主,下破看空为辅。

