黄金 GOLD 行情大局以及趋势分析大局趋势:熊市,周高点应该已经完成。
关键阻力:行情完成 W.5:5:3结构持续数周、甚至数月高点。
关键支撑:更低的周线收盘价这将是周高点已经完成的初始信号。
关键因素:上周已警告,在FOMC 会议当周,出现周线反转的概率较高。黄金与白银已经形成了教科书式的投机性高点以及衰竭性反转。
⚠更多交易分析及工具可以关注 NeuraAlgo 进行查看!
X-indicator

黄金反弹还是陷阱?黄金正在反弹——但背景很重要。
在强烈的抛售之后,价格现在正在回撤到一个关键的阻力区,没有打破结构。这是许多交易者被困于追逐“底部”的地方,而聪明的钱在分配。
市场结构
清晰的下行趋势:低高点和低低点保持完好
当前的走势 = 回撤,并不是强劲的看涨延续
价格在下降趋势线下反应
关键技术区
FVG / 供应区在5.26x左右 → 高概率反应区域
该区域与回撤水平和之前的失衡相一致
如果-那么场景
如果价格拒绝5.26x:
→ 下行趋势持续,目标4.63x → 4.51x → 4.40x
如果价格突破并保持在5.26x以上(H1收盘):
→ 看跌偏见减弱,等待新的结构再进行交易
交易心态
这是在抛售后的分配,而不是积累。
不要将反弹与趋势变化混淆。
📌 强劲的趋势不会安静地反转——它们首先会考验耐心。

XAUUSD - 高波动期,关注关键反应区。📌 市场背景
黄金目前在高波动环境中交易,经历了跌破5,000美元水平的剧烈下跌,反映出在主要宏观不确定性之前的激进重新定价。市场已经从平稳的趋势行为转向由流动性驱动、快速反应的阶段,价格在关键技术区域之间急剧波动。
随着美联储领导层的持续变化和未来货币政策方向的不确定性,黄金对预期、资金流动和新闻头条极为敏感。
➡️ 当前状态:波动条件 - 等待确认,避免情绪交易。
📊 结构与价格行动 (M30)
之前的看跌冲动正在失去动能,短期内开始形成更高的低点。
目前价格处于技术性恢复阶段,但尚未确认趋势反转。
市场仍然尊重需求和关键水平,产生剧烈反应。
此阶段未确认看涨CHoCH - 需要进一步验证。
🔎 关键见解:
黄金交易在一个决策区间内,每个关键水平都可能触发强烈的方向性波动。
🎯 交易计划 - MMF风格
🔵 主要情景 - 买入技术回调
专注于基于反应的执行,而非预测。
买入区间1:4,667 - 4,650
(近期需求 + 第一个恢复基础)
买入区间2:4,496 - 4,480
(深层需求 + 之前流动性扫荡低点)
➡️ 仅在以下情况下执行买入:
出现明确的看涨蜡烛反应
或在M30上形成更高低点结构
上涨目标:
TP1:4,932
TP2:5,124(主要恢复阻力 / 供应区)
🔴 替代情景 - 在阻力反应时卖出
如果价格回撤到供应区并未能保持看涨动能:
卖出区间:5,120 - 5,140
→ 寻找M30结构后的短期拒绝
❌ 无效化
M30确认收盘低于4,480将使恢复结构无效,并需要全面重新评估。
🧠 总结
黄金正处于高波动、构建结构的阶段,不适合情绪或激进定位。关键在于:
交易关键水平,而非冲动
等待价格确认
将风险管理置于预测之上
📌 在波动市场中,纪律胜过频率。


黄金GOLD趋势与基本交易策略周线复合:混合,但从超买区反转,初始信号已出现。
日线复合:在日低点完成之前,短期趋势应当横盘⾄下跌,约 4–5 天左右。
关键因素:黄⾦和白银已经形成了教科书式的衰竭性反转,这应当完成⼀个多周,甚⾄多月级别的顶部。
交易策略建议:黄⾦和白银都已经形成了更低的周线收盘价,其中白银的收盘价低于此前连续两周的周线收盘价。
⚠ 短期交易者应以TradingBox信号系统为准!


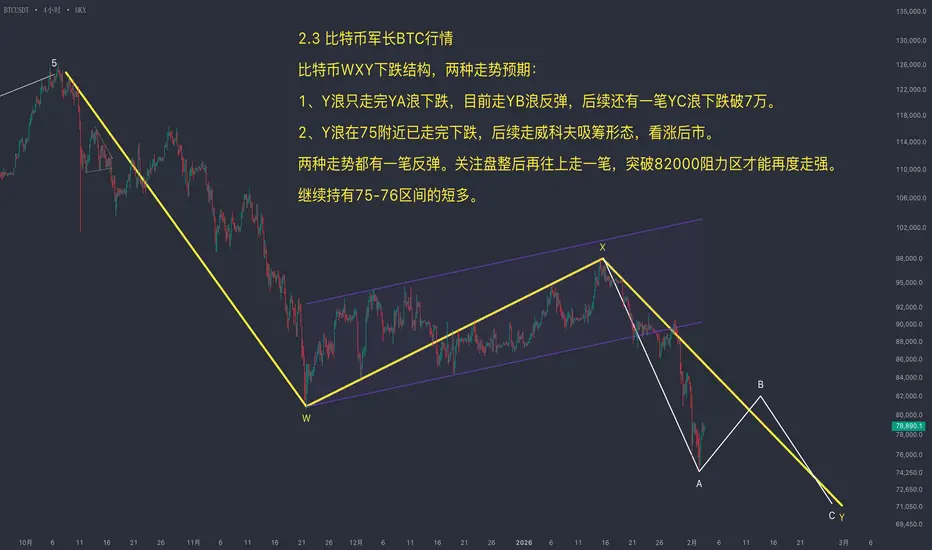
2.3 比特币走势分析:自75000点反弹第一段完成进入横盘,震荡后上行第二目标看向82000点关键阻力,突破与否决定反弹级别(2.3 比特币价格今日行情:比特币从75000点附近的反弹,其第一段已于79000点附近完成,目前价格进入横盘震荡阶段。预期震荡结束后将启动第二段上行,目标指向约82000点的关键阻力区域,该位置亦与斐波那契1.618扩展位重合。
当前策略以持有多单为主,核心关注点在于价格抵达82000点附近时,能否有效突破。若无法突破,则需考虑止盈离场;若能强势突破,则反弹空间可进一步看高。
金汇得手:黄金开盘拉升 今日主多辅空走势 美元指数昨天收阳,今天关注97-98区间。
黄金昨天低开,再次大跌接近500点到4400附近,日线长影阴线。单看收线,今天倾向上涨,早盘开盘拉升100多美金。但是如果昨天高点不破,行情大概率也上不去或大区间震荡为主。目前 下方支撑日内低点附近,触及可以做多。强支撑4590和4400,今天大概率不会再触及。阻力昨天高点附近,触及可以小止损空。行情如果站稳4900,上方再看100-250美金,触及再空。
操作建议:接近日内低点和昨天低点多,接近昨天高点空,见5000或5140都是做空位置。昨天早盘4700多,4600多,4767空,4400附近多,美盘4675多。
原油低开收大阴,低点正好是周线支撑,不破可以小止损多。上方阻力62.6附近,也是日内多空分水,不破暂时看62.6-61.3区间,站稳继续看63.3甚至昨天高点附近,触及可以再空。分析仅供参考,实盘为准。

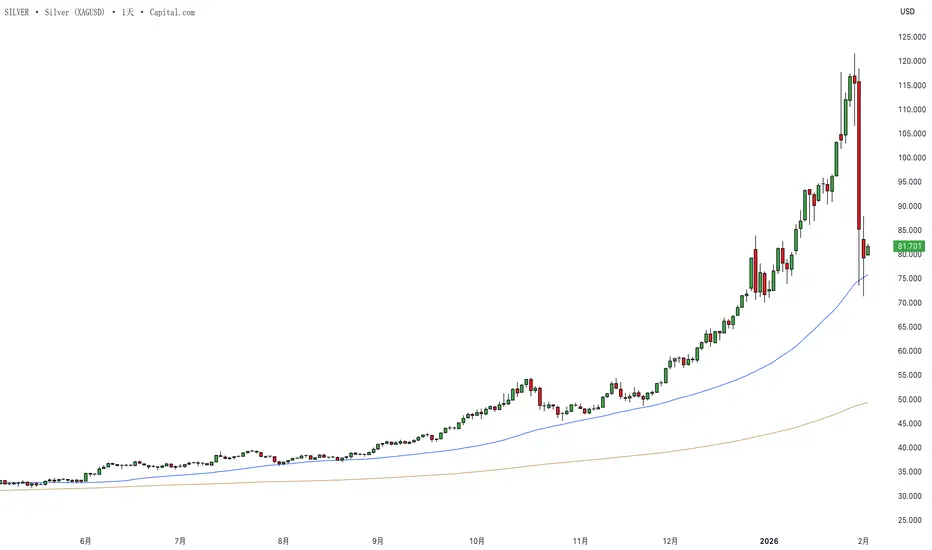
白银急挫震撼市场:反形态正在酝酿?年初出现近乎指数型的强劲涨势后,白银在上周五出现戏剧性的回落,光芒瞬间黯淡。本文将解析这波急跌背后的关键因素,并探讨一种较少被讨论、但可能在接下来几个交易日逐步成形的技术形态。
特朗普提名美联储主席人选,贵金属泡沫被戳破
1 月期间,随着政治不确定性与通胀担忧升温,资金大量涌入被视为避险资产的贵金属。白银表现尤为突出,与黄金、铂金同步大幅上涨,动能持续堆叠,市场仓位也逐渐趋于单边。
然而,当唐纳德·特朗普正式确认提名 Kevin Warsh 为下一任美联储主席人选后,市场预期出现明显转变。该任命强化了对通胀纪律的预期,并支撑美元走强,直接动摇了贵金属上涨的核心支柱。在情绪与仓位本就偏向极端的背景下,市场风向的突然转变,引发了整个贵金属板块快速且失序的回调。
顶部结构浮现,为“反形态”打开空间
从白银的日线 K 线来看,目前走势几乎可视为教科书级别的趋势末端情境。2025 年大部分时间,白银维持稳健而持续的上升趋势;进入新年度后,涨势明显加速,近乎指数型推进,吸引了大量追高的末端买盘。
这波最后的急拉,正是市场变得脆弱的关键。当信心高涨、仓位过度集中,任何外在变量都可能成为引爆点。
上周五的价格行为,标志着结构性的转折。一开始看似只是获利了结,但很快演变成更为混乱的抛售,错站方向的交易者被迫快速降低敞口。从跌幅的规模与 K 线结构来看,这并非一次例行性修正,而是对一段长期未曾受到严格考验的趋势,所发出的首次实质挑战。
低周期观察:典型顶部过程正在发展
进一步观察小时级别走势,可以看到更清晰的细节。近期的价格行为显示,白银在高点附近迟迟无法有效突破,随后卖压逐步累积,形成典型的顶部过程。
“加速上涨 → 高位停滞 → 下行动能快速扩散”的组合,往往正是反形态开始酝酿的位置。尽管在日线级别上,形态尚未完全确认,但市场行为的转变已相当明确。接下来几个交易日白银的表现,将是判断这波走势仅属修正,还是具有更深层结构性意义的关键。
白银(XAG/USD)日线 K 线图
过往表现并非未来结果的可靠指标
白银(XAG/USD)小时线 K 线图
过往表现并非未来结果的可靠指标
免责声明
本文仅供信息与学习用途,不构成任何投资建议,亦未考虑任何投资者的个别财务状况或投资目标。文中提及的过往表现,并非未来结果或绩效的可靠指标。社交媒体内容不适用于英国居民。
差价合约(CFD)及点差交易属于高风险杠杆型金融产品,可能在短时间内造成重大损失。**85.24% 的零售投资者账户在本平台交易差价合约及点差交易时遭受亏损。**请在交易前确认您已充分了解其运作方式,并评估自己是否能够承担相关风险。

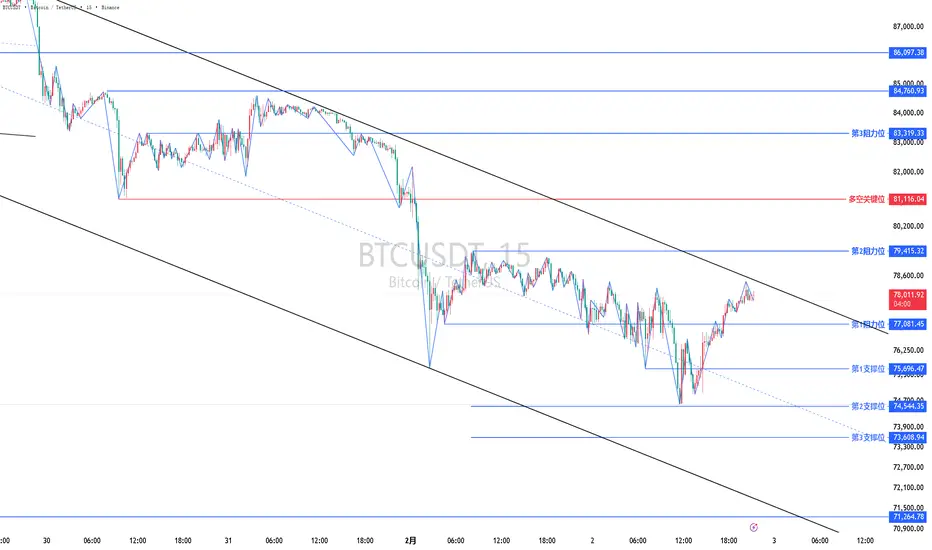
(有梦分析)多空关键位之下偏空,以回调看空为主,二次不破前低回调看多为辅。或背靠下跌通道高抛低吸为主,突破看多,下破看空为辅。多空关键位之下偏空,以回调看空为主,二次不破前低回调看多为辅。或背靠下跌通道高抛低吸为主,突破看多,下破看空为辅。
比特币 BTC 行情大局以及趋势分析大局趋势:熊市未来3-4周应该以空头为主。
关键阻力:Close > 97,965,这是 1 月 14 日的摆动高点收盘价。在下一次日线动能周期与熊市反转出现之后,应该能够确定一个更近的止损位。
关键支撑:76,000,这应该是在周线低点完成之前的最小下行目标。
关键因素:上周的日线收盘价跌破 12/19 的 W.B收盘价,确认了一个周线高点以及ABC 修正已经完成,并且该趋势应当在接下来的 3–4 周内继续保持整体偏空。
⚠更多交易分析及工具可以关注 NeuraAlgo 进行查看!

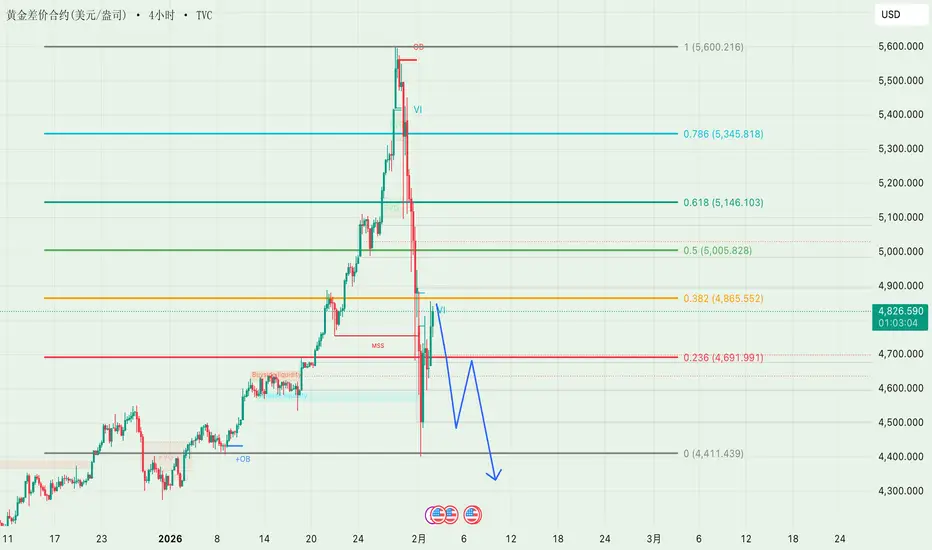
CME提高金属保证金 → 周一缺口风险?| 黄金关键影响黄金不再自由波动——它正在进行结构性的调整。
在创出历史新高(ATH)后,XAUUSD出现了明确的结构变化(CHoCH),随后出现了一系列看跌的突破(BOS),确认了这次调整是可控的,而非恐慌性抛售。价格目前正尊重一个下行的修正通道,这通常出现在市场决定下一个主要走势之前。
🧠 基本面背景(流动性 > 头条新闻)
CME提高了贵金属的保证金要求
更高的保证金 = 强制性减少杠杆交易者的头寸
这通常会在周初造成流动性驱动的缺口
重要提示:这是机械性压力,而不是宏观趋势的逆转
➡️ 预计首先会有波动,随后才是清晰的趋势。
📊 技术结构(高时间框架 → 低时间框架)
ATH拒绝 + CHOCH = 看涨动能暂停
通道内的多个突破 = distribution阶段
价格正向关键流动性区间收缩
🔑 关键水平
5,090 – 5,120:上通道 / 卖方反应区
4,620缺口区域:如果周一开盘有缺口,则为高概率流动性磁铁
4,410支撑区:高时间框架需求及通道底部(关键水平)
🎯 情景(如果 – 则)
如果周一缺口到4,620
→ 预计剧烈波动和假突破
→ 在任何看涨偏见之前,等待接受/吸收
如果价格干净利落地失守4,620
→ 下一个目标 = 4,410支撑
如果价格迅速回升至4,900以上
→ 缺口可能成为陷阱 → 压缩回到区间内

XAUUSD (H1) - 低于5000$: 回调还是快速反弹?市场背景 – 黄金进入关键重定价区域
黄金已正式跌破心理价位5,000美元,引发了新的讨论:
这是更深纠正阶段的开始,还是在急剧反弹之前的流动性重置?
时机至关重要。
由于对美联储领导层变动和未来货币政策方向的猜测,市场正在积极重定价风险。这给黄金注入了极大的波动性,流动性正在迅速重新分配,而不是干净的趋势。
➡️ 这不再是低波动性的趋势市场——这是一个决策区域。
结构与价格动作(H1)
之前的看涨H1结构已经失败,确认了短期纠正阶段
价格交易在之前的需求之下,现在 acting as supply
当前反弹为技术性回调,而非确认的反转
下行动能仍然活跃,直到价格重新占领关键结构水平
关键洞见:
👉 在5,000美元以下,黄金处于重平衡模式,而非趋势延续。
关键技术区域(H1)
主要供给 / 拒绝区域:
• 5,030 – 5,060
→ 之前的结构 + 斐波那契重合
→ 卖方可能防守的区域
中位反应区域:
• 4,650 – 4,700
→ 短期需求 / 潜在反弹区
深层流动性需求:
• 4,220 – 4,250
→ 主要流动性吸纳区
→ 技术性或结构性反弹的高概率区域
交易计划 – MMF风格
情景 1 – 卖出回调(主要在5,030以下)
在价格反弹至供给区时偏向卖出设置
等待拒绝 / 失败模式
不要追逐价格下跌
➡️ 在5,030以下偏向看跌纠正
情景 2 – 仅在深层流动性时买入
仅在主要需求处并确认时考虑买入:
• 4,650 – 4,700(仅供短线/反应)
• 4,220 – 4,250(更高概率的波段区域)
➡️ 不要盲目抄底
➡️ 确认 > 预测
宏观风险展望
美联储领导层不确定性 = 政策预期波动
任何转向鸽派可信度的变化可能引发剧烈的补空反弹
相反,长期不确定性短期内将黄金维持在压力之下
➡️ 预期快速波动、虚假突破和宽幅震荡
无效与确认
如果H1重新占领并维持在5,060以上,看跌偏向减弱
若4,220果断失败,深度修正将开启
总结
黄金在5,000美元以下并不是弱势——而是重定价。
这是一个流动性狩猎交易者的市场,而不是反过来。
现在的优势是耐心和精准:
在供给区卖出反弹
仅在流动性被证明的地方买入
在承担风险之前让结构确认
➡️ 在高波动性中,生存胜于预测。

比特币趋势与交易策略周线复合:周线⾼点应已完成,趋势在未来约 2-3周内整体横盘⾄下⾏。(熊)
日线复合:日线低点应非常接近,但任何上涨都应当只是周线熊市趋势中的修正,⽽该周线熊市趋势预计还将持续 约 2–3 周。(熊)
关键因素:跌破 11/21 的收盘价,确认了⼀个周线⾼点已经完成,并且任何上涨都应当被视为周线熊市趋势中的修正。
交易策略建议:只要没有收盘价⾼于 1 月 14 日的摆动⾼点收盘价,趋势在2 月中下旬之前都应以偏空为主。
⚠ 短期交易者应以TradingBox信号系统为准!


青岚加密课堂:2月2日 BTC分析| 暴跌后的比特币:抄底还是逃命?欢迎来到青岚加密课堂,咱们今天对BTC 四个周期包括消息面进行分析:
首先,技术面咱们多周期联动着看:
* 日线级别(长期趋势):哎哟,这个空头格局是明牌啦。价格已经跌穿了所有主要均线,MA5、MA10、MA20呈现完美的空头排列。MACD在零轴下方死叉,绿柱子老长了,RSI在22.5,妥妥的超卖区域。这说明大趋势还是向下没跑,空头力量非常强。不过呢,昨天(2月1日)那根日K线收了根带长下影的阴线,说明在76000-77000美元附近有资金尝试抄底,但今天这根K线目前还是阴线,反弹力度很弱,止跌信号还需要确认。
* 4小时级别(中期趋势):和日线同步,也是空头排列。价格被MA5死死压着,每次反弹到MA5附近就被打下来。MACD同样在零轴下方,虽然绿柱子有缩短迹象,但双线距离零轴还很远,属于下跌中继的弱势反弹。关键阻力就在78000-78500(MA5附近),过不去就还是下跌通道。
* 1小时级别(短期趋势):这里稍微有点意思。价格在76000-78000这个区间内反复震荡,形成了一个小的箱体。MACD在零轴下方有金叉的迹象,但力度很弱,更像是下跌后的横盘修复。RSI在35附近徘徊,既不算强也不算弱。这个级别告诉我们,暴跌之后市场在喘气,多空暂时平衡,但平衡很脆弱。
* 15分钟级别(超短期动向):这就是咱们看盘口的节奏了。价格在小区间内上蹿下跳,波动剧烈。MACD在零轴附近反复粘合,没有明确方向。这说明在1小时级别的箱体内,多空双方在进行高频的拉锯战,任何一方都还没取得压倒性优势。
然后,咱们把消息面揉进来看:
消息面简直是“雪上加霜”哦。核心就三点:
1. 宏观鹰派冲击:沃什可能被提名为美联储主席的消息,让市场担心“缩表”加速,全球流动性收紧。这直接带崩了黄金、白银,风险资产BTC自然也难以独善其身。
2. 内部杠杆出清:隔夜高达25亿美元的清算(消息#47),尤其是16亿美元的多头爆仓(消息#3),说明市场里过热的杠杆被暴力清洗了一波。链上数据也显示市场从“相信”转向“焦虑”(消息#2),这是情绪降温的表现。
3. 结构性担忧:市场在担心MicroStrategy这类高杠杆大户会不会被迫抛售(消息#4、#19),虽然Saylor嘴硬说“更多橙色”(消息#44),但这种担忧本身就会压制买盘。
所以,咱们的综合预判和做单思路就很清晰了:
当前市场是 “长期和中期趋势明确看跌,短期进入超跌后的震荡修复阶段” 。消息面全是利空和担忧,没有任何能立刻扭转趋势的利好。技术上的超卖(日线RSI极低)只能带来反弹,但反转需要更强的买盘和基本面配合,目前看不到。
做单思路(仅供教学讨论,不构成投资建议):
1. 对于激进型选手:可以依托 1小时级别的箱体(76000-78000) 做高抛低吸。靠近78000(同时也是4小时MA5压力) 尝试轻仓做空,止损放在78500上方;靠近76000前低区域 可以尝试博反弹多单,但必须严格止损在75500下方。记住,这只是短线抢反弹,快进快出,有利润就跑。
2. 对于稳健型选手:建议继续观望,或者只做空不做多。因为大趋势向下,顺势而为才是王道。可以等待价格 反弹至4小时级别MA5(约78000-78500) 或者 1小时箱体上沿 附近,出现滞涨信号(比如上影线、指标背离)时,再布局空单,看向前低76000,甚至更低。
3. 关键风控位:上方强阻力在78500-79000(4小时MA5+前期小平台),这里过不去,空头格局不变。下方关键支撑在76000-75500,这里如果有效跌破,下跌空间会再次打开,可能直奔74000甚至更低。
最后,青岚姐送大家一句今天的心得:
“在趋势的洪流里,逆势抄底是勇者的游戏,但顺势而为才是智者的生存之道。当市场用暴跌完成‘风险教育’时,我们要做的不是急于证明自己勇敢,而是先确保自己活着。” 咱们一起保持冷静,耐心等待更确定的信号。好了,今天的分析就到这里,大家有什么问题,咱们评论区见!
-------------------------
受限于图表篇幅和平台合规准则,行情分析有时效性,
最新的分析已更新在我的青岚加密课堂:qinglan.org
或欢迎点击我的头像关注我,通过主页展示的渠道进行更多技术探讨。

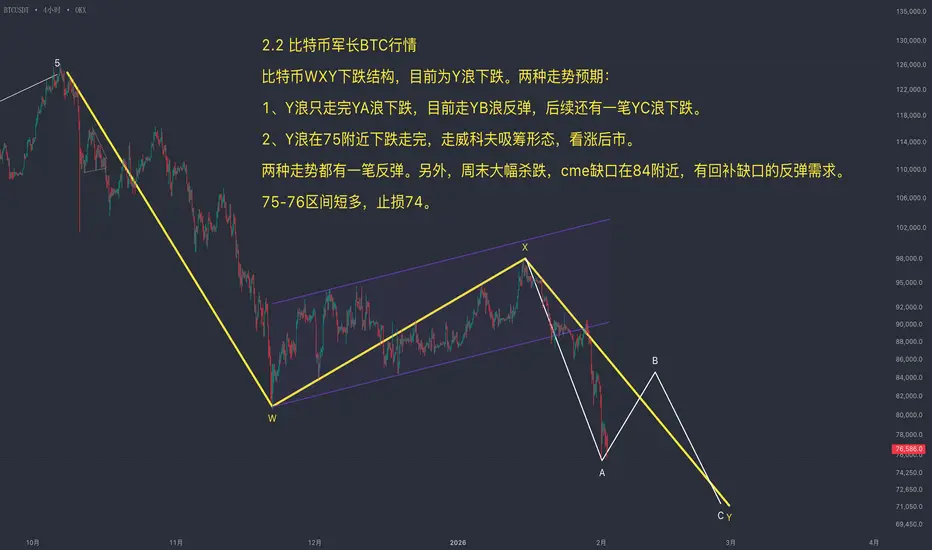
2.2 比特币走势分析:周末市场遭现货砸盘狙击,结构显示短期反弹需求强烈,Y浪目标与缺口回补成为焦点(比特币合约交易)军长2.2 比特币价格今日行情:周末期间,市场遭遇某交易所超过10亿美元的现货砸盘,导致价格暴跌近10%,这是一次典型的利用流动性匮乏时段对散户合约的精准狙击。
从结构上看,自126,000美元开始的W-X-Y浪型中,当前已确认处于Y浪下跌。Y浪存在两种潜在目标:短期可能在75,000美元附近(W浪的0.618)结束;长期则可能走等长结构,反弹后仍需再探新低。
同时,威科夫模型显示价格处于测试支撑阶段,芝加哥交易所开盘形成的巨大跳空缺口也亟待回补。多种技术视角均指向短期有强烈反弹需求。
智者生存:黄金冲击5600,注意风险!!交易小Tips:知于行永远是理论最大的问题
复盘分析:行情受阻整理,没有出现比较大的调整后第二天直接反包,延续涨势,行情极速上行,冲击5600区域
市场分析:昨日黄鱼继续上行,单日振幅250+,日线表现上行情进入了极端的上涨行情,不管是幅度还是速度都是前所未有的大,行情进入“抢购高潮”,这很容易出现中长期投资者的获利了结,行情很容易进入阶段性顶部,当前行情还在上涨趋势,箜头没有表现之前,中短期可以看哆做哆,但一定要谨慎哆,做好防守
如果加速上行后出现极速下行的情况,不要被市场的热度冲昏了头脑,认为“回调”就是做哆的机会,这种情况若出现顶部,套住你的可不止一两个月


