The New Bitcoin Price Prediction From This Expert Warns of 40% BTC Crash to Just $70K
Bitcoin (BTC) price bull market has ended after the cryptocurrency failed to sustain momentum above $125,000, according to Jon Glover, Elliott Wave analyst and Chief Investment Officer at Ledn.
His newest Bitcoin price prediction shows a prolonged bear market potentially driving prices to $70,000 or lower, representing a 40% decline from current levels. The bearish call comes after Bitcoin tumbled from a record $126,198 to $104,000 in mid-October, confirming the completion of a five-wave bullish structure that began in late 2022.
Why Bitcoin Will Crash? This Expert Has The Answer
The analyst, known for precise market forecasts including his accurate August prediction of Bitcoin surging toward $125,000 when others turned bearish, declared that "the bull run in Bitcoin is over" after the cryptocurrency broke below the critical $108,000 level.
Ledn@hodlwithLedn10月 17, 2025My expectation is that the bear market will see us trading down to $70 - $80k, and potentially lower.
The bear market target will become clearer as we watch the price action unfold in the coming months.
🧵3/4
"I firmly believe we have completed the five-wave upward move and are now entering a bear market that may last until at least late 2026," Glover stated in his October 17 analysis. "I expect Bitcoin to trade between $70K and $80K, and possibly even lower."
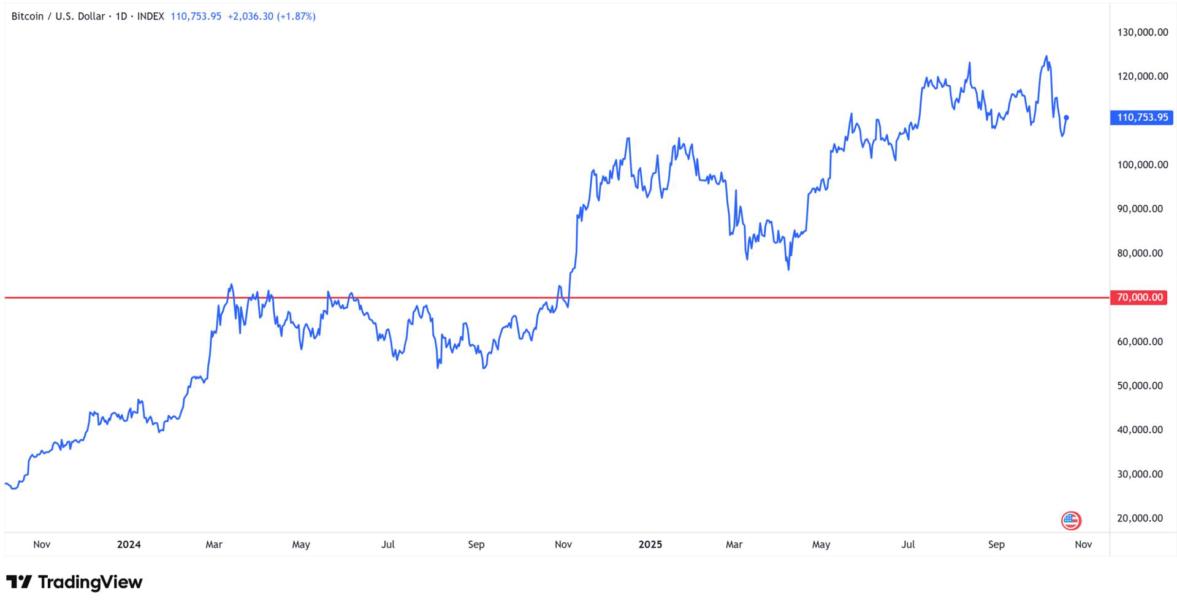
According to Glover, Bitcoin price can fall this low. Source: Tradingview.com
Bitcoin Price Prediction Based on Elliott Wave Theory
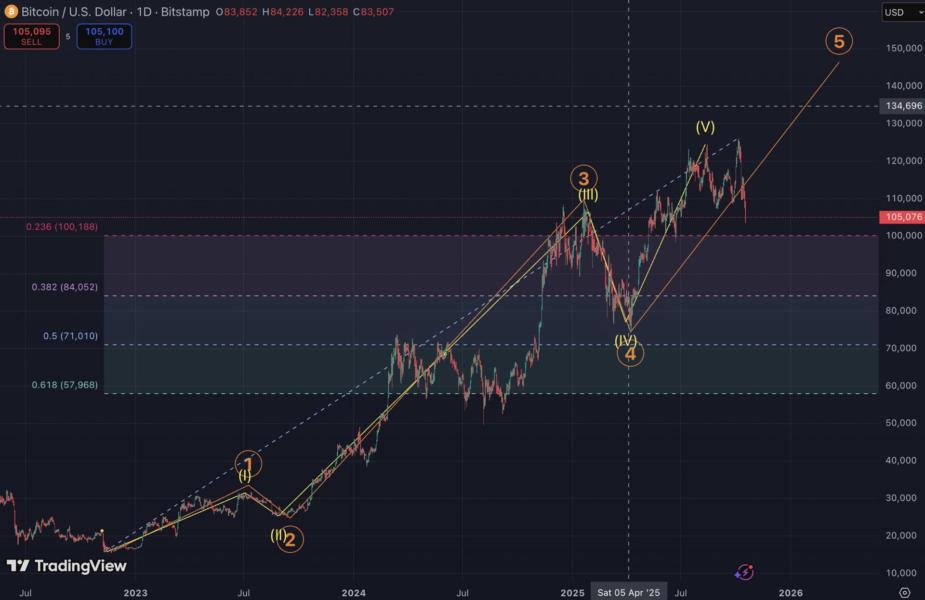
Elliott Wave Theory, introduced by Ralph Nelson Elliott in 1938, posits that collective investor psychology moves in predictable cycles forming a five-wave structure in the direction of the main trend, three impulse waves and two corrective waves.
Glover initially projected wave 5 would bring prices between $140,000 and $150,000 by year-end, making this call in early August against a backdrop of growing bearish concerns after Bitcoin dipped from $120,000 to $112,000. While prices surged as forecasted, momentum stalled beyond $125,000 this month. In early October, before the collapse, Glover had warned that "if we reject a couple of attempts at $125k, then there is merit to the argument that we will begin a bear market for BTC".
Source: Ledn
The subsequent tumble to $105,000 last week confirmed an early end to the bull run. "Now that we have broken down below $108k, I am ready to make the call as to whether we are on the orange path in the chart below and therefore looking for a move up to $145k, or are on the yellow path, which would mean that we have seen the highs in this market," Glover explained in his detailed Twitter thread. "Here's my call: THE BULL RUN IN BITCOIN IS OVER!"
Ledn@hodlwithLedn10月 17, 2025Here’s my call: THE BULL RUN IN BITCOIN IS OVER! I firmly believe that we have finished the five wave move higher, and we will now commence a bear market that will last into late 2026 at a minimum.
That’s not to say that we can’t retest the $124k, or even slightly higher, but…
Bitcoin's Five-Wave Bull Market Structure (2022-2025)
- Wave1: Initial rally from $16,500 to $31,000(December 2022 - April 2023)
- Wave2: Correction to $24,800 support (April - June2023)
- Wave3: Explosive surge to $73,000 (June 2023 -March 2024)
- Wave4: Consolidation between $58,000-$72,000(March - September 2024)
- Wave5: Final push to $126,198 all-time high(October 2024 - October 2025)
Technical Breakdown Below $108K Triggers Bearish Call
Glover's decision to officially declare the bull market over came after Bitcoin broke down below $108,000. The "orange path" on his Elliott Wave chart suggested one final push toward $145,000, while the "yellow path" indicated the market had already seen its highs.
Based on my technical evaluation, the breakdown below $108,000 coincided with failure to maintain position above the 50-day exponential moving average at $114,222, while the 200-day EMA at $107,762 now serves as immediate support. The cryptocurrency briefly penetrated this level during last week's crash to $103,602, suggesting vulnerability to deeper correction if support fails decisively.
Glover explained that while the possibility of Bitcoin retesting record highs around $124,000 or climbing slightly higher cannot be ruled out, "the broader trend has now flipped bearish, meaning prices are likely to be lower a few months from now". This assessment acknowledges that bear market rallies often deceive investors with temporary strength before resuming downward trajectories.
BTC Bear Market Timeline Extends Through Late 2026
Glover's forecast that the bear market "may last until at least late 2026" suggests a 12-15 month correction period from the October 2025 peak. This timeline aligns with historical bear market durations, with the 2022 crypto winter lasting approximately 12 months (November 2021 to November 2022), the 2018 bear market extending 13 months (December 2017 to January 2019), and the 2014-2015 correction persisting 14 months.
The extended timeline implies Bitcoin will likely test support multiple times rather than experiencing a single capitulation event, with the typical bear market structure involving initial panic selling, a relief rally that fails at descending resistance, followed by grinding lower into final lows before accumulation begins.
Institutional investors and sophisticated traders positioning for downside through September 2026 options expiries—as evidenced by elevated put premiums—suggests market participants are preparing for prolonged weakness rather than expecting quick V-shaped recovery.
Macro Factors Reinforce Bearish Technical Outlook
Beyond Elliott Wave technicals, multiple macro catalysts support the case for extended Bitcoin weakness.
Geopolitical Risks:
- Trump's 100% tariff threat onChina (triggered weekend $18K crash)
- Ongoing trade war escalationthrough November 1st implementation
- Regional banking stresscreating systemic concerns
Monetary Policy:
- Fed holding rateshigher-for-longer contrary to September expectations
- Inflation remaining elevatedaround 3% reducing rate cut urgency
- Higher opportunity cost fornon-yielding assets
Market Structure:
- Overleveraged derivatives ($39Bperpetual futures open interest)
- Liquidation cascadevulnerability in thin liquidity periods
- Correlation with equitiescreating contagion risk if stocks correct
Bitcoin Price Analysis, FAQ
How low can Bitcoin go in 2025-2026?
Elliott Wave analyst Jon Glover forecasts Bitcoin trading between $70,000-$80,000 and potentially lower during a bear market expected to last until at least late 2026, representing a 35-44% decline from the October 2025 peak at $126,198, with Glover stating "I expect bitcoin to trade between $70K and $80K, and possibly even lower".
Will Bitcoin crash to $70,000?
Glover firmly believes Bitcoin's five-wave bull market structure completed in October 2025, declaring "the bull run in Bitcoin is over" after breakdown below $108,000 triggered bearish Elliott Wave count expecting 12-15 month correction toward $70,000-$80,000 range, supported by Deribit options showing elevated put premiums through September 2026 and historical halving cycle patterns.
What causes Bitcoin price crashes?
Bitcoin crashes result from completion of Elliott Wave impulsive structures triggering corrective patterns, overleveraged derivatives positions forcing liquidations ($530.9M and $366.6M consecutive daily ETF outflows), geopolitical catalysts (Trump 100% China tariffs), technical breakdowns below key moving averages, institutional profit-taking after 665% gains, and historical four-year halving cycle patterns consistently showing 18-month peaks followed by prolonged corrections.
Should I sell Bitcoin now?
Bitcoin trading at $110,507 faces bearish Elliott Wave structure with Glover warning "the broader trend has now flipped bearish, meaning prices are likely to be lower a few months from now," though invalidation of bearish count requires sustained move above $115,000-$120,000, creating binary outcome requiring careful risk assessment reflecting individual risk tolerance and investment timeline.