OPEN-SOURCE SCRIPT
Azmi Moving Averages
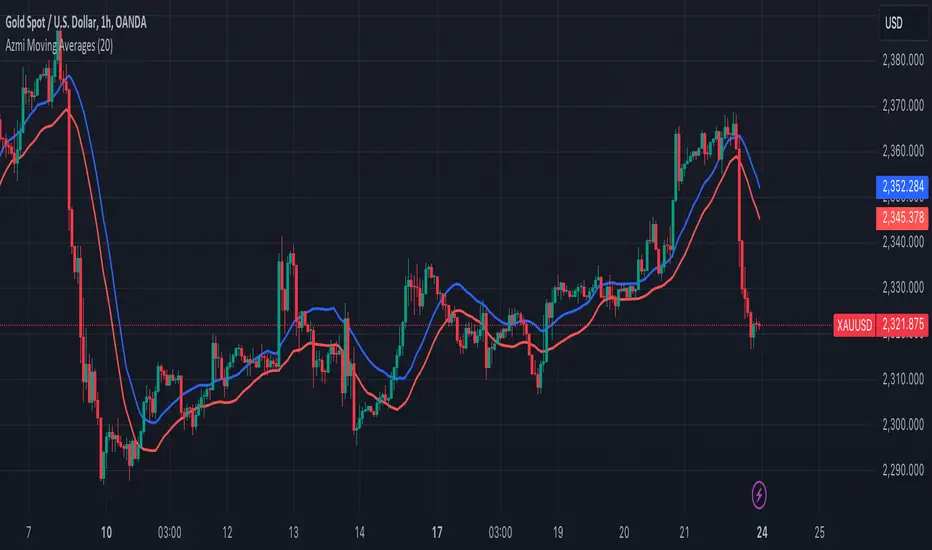
This trading indicator, designed using Pine Script, incorporates two simple moving averages (SMAs) with the same length but different data sources. Here's a detailed description of the indicator:
### Indicator Overview
**Name:** Two Moving Averages
### Inputs
1. **Length (20):** The period over which the moving averages are calculated. Both moving averages use a length of 20 periods.
2. **Source:**
- **High:** The first moving average is calculated using the high prices of the candles.
- **Low:** The second moving average is calculated using the low prices of the candles.
### Calculations
1. **MA High (maHigh):** This is the simple moving average of the high prices over the specified length (20 periods). It smooths the high prices over time, showing the average high price trend.
2. **MA Low (maLow):** This is the simple moving average of the low prices over the same length (20 periods). It smooths the low prices over time, showing the average low price trend.
### Plotting
- **MA High (Blue Line):** This line represents the moving average of the high prices. It is plotted in blue with a line width of 2.
- **MA Low (Red Line):** This line represents the moving average of the low prices. It is plotted in red with a line width of 2.
### Interpretation
1. **Trend Identification:**
- **Bullish Trend:** When the MA High is above the MA Low, it generally indicates a bullish trend, as the average high prices are higher than the average low prices.
- **Bearish Trend:** When the MA High is below the MA Low, it suggests a bearish trend, as the average high prices are lower than the average low prices.
2. **Support and Resistance:**
- The MA High can act as a dynamic resistance level, where the price may face selling pressure.
- The MA Low can act as a dynamic support level, where the price may find buying interest.
3. **Price Channels:**
- The area between the MA High and MA Low creates a channel that can help traders visualize the range within which the price is fluctuating. This channel can be used to identify potential breakout or breakdown points.
### Example Usage
- **Buy Signal:** A potential buy signal may occur when the price crosses above both the MA High and MA Low, indicating a possible upward trend.
- **Sell Signal:** A potential sell signal may occur when the price crosses below both the MA High and MA Low, indicating a possible downward trend.
This indicator provides a visual representation of the average high and low prices, helping traders identify trends, potential support and resistance levels, and price channels for better trading decisions.
开源脚本
秉承TradingView的精神,该脚本的作者将其开源,以便交易者可以查看和验证其功能。向作者致敬!您可以免费使用该脚本,但请记住,重新发布代码须遵守我们的网站规则。
免责声明
这些信息和出版物并非旨在提供,也不构成TradingView提供或认可的任何形式的财务、投资、交易或其他类型的建议或推荐。请阅读使用条款了解更多信息。
开源脚本
秉承TradingView的精神,该脚本的作者将其开源,以便交易者可以查看和验证其功能。向作者致敬!您可以免费使用该脚本,但请记住,重新发布代码须遵守我们的网站规则。
免责声明
这些信息和出版物并非旨在提供,也不构成TradingView提供或认可的任何形式的财务、投资、交易或其他类型的建议或推荐。请阅读使用条款了解更多信息。