OPEN-SOURCE SCRIPT
已更新 Encapsulation Box
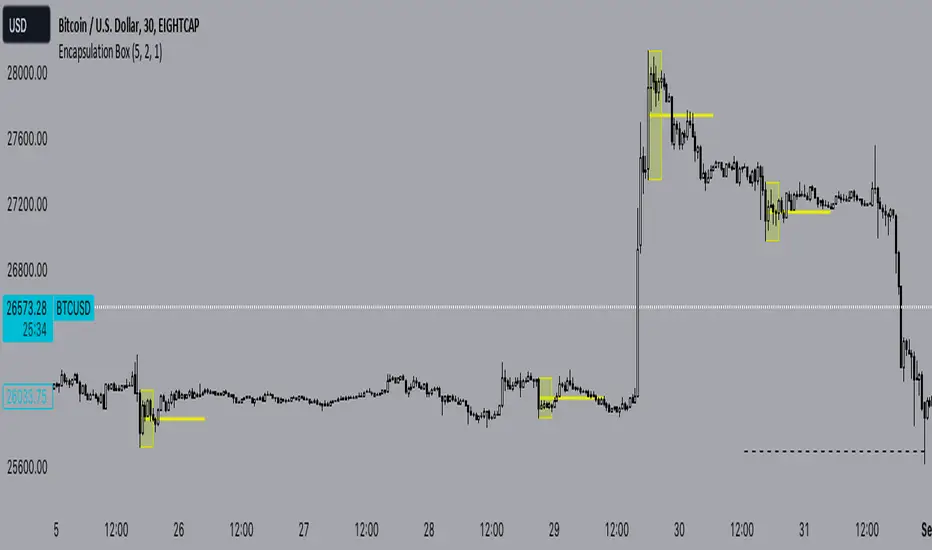
The “Encapsulation Box” indicator is designed to locate areas of the chart where the highs and lows of candlesticks are “embedded” or enclosed within the body of a previous candlestick. This setup indicates a significant contraction in the market and can provide important trading signals. Here's how it works in more detail:
Detecting contraction: The indicator looks for situations where the price range of the candles is very narrow, i.e. when subsequent candles have highs and lows that are contained within the range of a previous candle. This condition indicates a contraction in the market before a possible directional move.
When a contraction is detected, the indicator draws a rectangle around the area where the highs and lows of the candles are embedded. The rectangle has its upper vertex corresponding to the maximum of the candles involved and its lower vertex corresponding to the minimum. The width of the rectangle is defined by can be customized by the user.
A key feature of this indicator is the horizontal line drawn outside the rectangle. This line is positioned in the middle of the rectangle and represents 50% of the range of the rectangle itself. This line acts as a significant support or resistance level depending on the direction the contraction breaks.
The indicator can generate buy or sell signals when a break in the rectangle or horizontal line occurs. For example, if the price breaks above the rectangle and the horizontal line, it could generate a buy signal, indicating a possible uptrend. Conversely, if the price breaks below the rectangle and the horizontal line, it could generate a sell signal, indicating a possible downtrend.
版本注释
Added Alert版本注释
Optimized Alert, in this version it includes the bar index where the new box is formed in the alert message开源脚本
秉承TradingView的精神,该脚本的作者将其开源,以便交易者可以查看和验证其功能。向作者致敬!您可以免费使用该脚本,但请记住,重新发布代码须遵守我们的网站规则。
免责声明
这些信息和出版物并非旨在提供,也不构成TradingView提供或认可的任何形式的财务、投资、交易或其他类型的建议或推荐。请阅读使用条款了解更多信息。
免责声明
这些信息和出版物并非旨在提供,也不构成TradingView提供或认可的任何形式的财务、投资、交易或其他类型的建议或推荐。请阅读使用条款了解更多信息。