INVITE-ONLY SCRIPT
Njord - Hidden Volume Divergence
Hi guys,
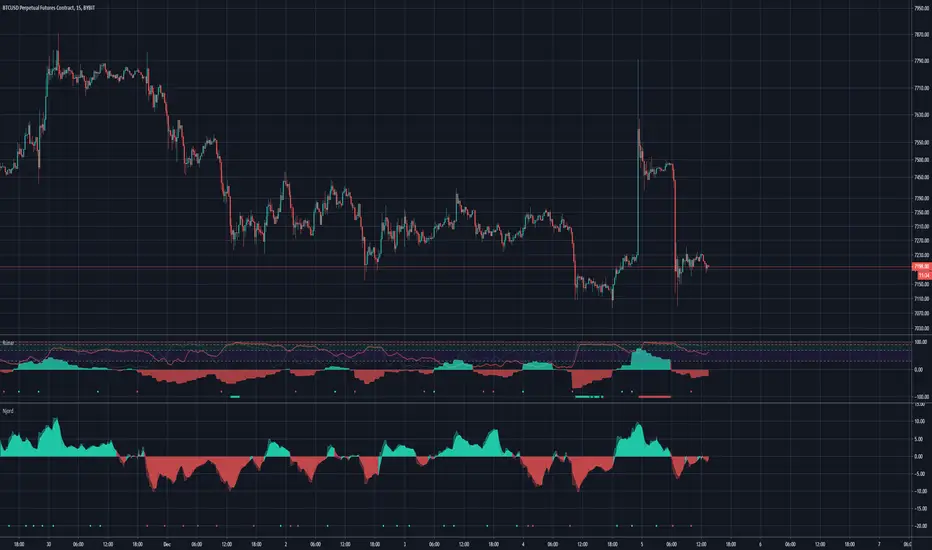
Been a while since I published something but here we go! Njord is a pure volume indicator focused on predicting large movements in price and its direction based on hidden divergences in underlying price and volume structures. Exchanges do not give us the split between buy/sell volume but we can infer from candles and its underlying volume , what the market may do in the short term.
The indicator is split into two primary sections, one shows the overall volume we are observing across multiple time frames as bullish and bearish waves. The first wave renders the real change in volume with a backing EMA wave of the first to show that rate of change up and down.
The bottom half of the indicator has "signals" or dots printed to inform you of larger moves coming, always with the dominant side. A green dot will see a surge in price up and a red dot will see us drop . The higher the time-frame the larger the move will be.
I found most success with this indicator flipping from the 4h - 1h - 15m and when all are aligned, dots can be used as reactive signals on the 15m and 1h.
免责声明
这些信息和出版物并不意味着也不构成TradingView提供或认可的金融、投资、交易或其它类型的建议或背书。请在使用条款阅读更多信息。