PROTECTED SOURCE SCRIPT
已更新 Order Flow Analysis

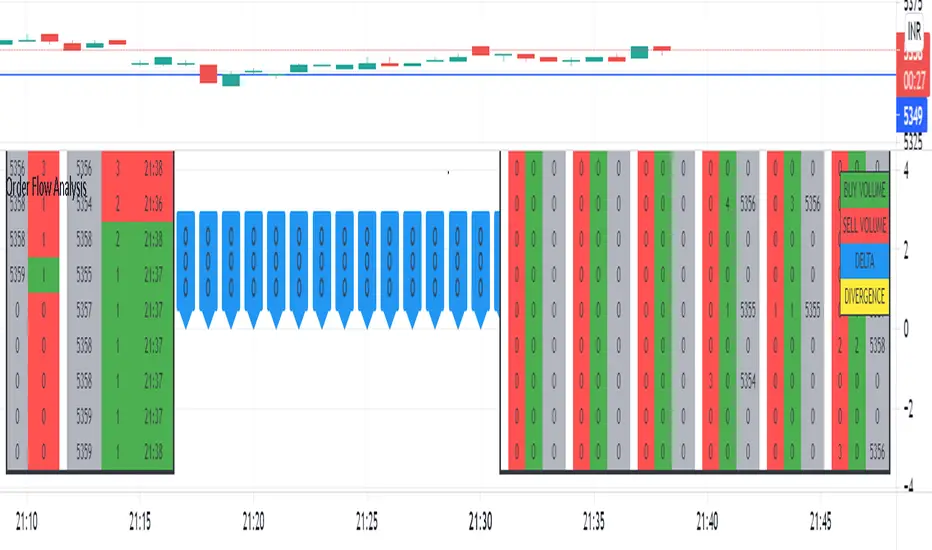
The script plots the order flow clusters for the last six candles in the middle right.
The cluster contains buy volume, sell volume and the price range of the volume.
It calculates uptick volume as buy volume and down tick volume as sell volume and calculates the delta(shown in labels). Recent ATR is considered to determine each cell price range in the cluster.
At the left side, the top volume ticks and the live ticks are displayed.
Please note this works only during market trading hours.
Do not refresh the browser tab and do not change the timeframe, which will cause a reset of numbers.
版本注释
Delta divergences are shown in labels with yellow color. Labels are present at 0 price.Please scroll and zoom to get the delta labels.Minor enhancements and bug fixes.
版本注释
Minor enhancements.版本注释
converted to V5The delta bars now overlay on the chart ( can also be separated into new pane below)
Delta bars size, font size, color and number of required bars can be changed
minor improvements and fixes
Delta labels will be aligned automatically below day's low with an offset that can be changed.
受保护脚本
此脚本以闭源形式发布。 但是,您可以自由使用,没有任何限制 — 了解更多信息这里。
免责声明
这些信息和出版物并非旨在提供,也不构成TradingView提供或认可的任何形式的财务、投资、交易或其他类型的建议或推荐。请阅读使用条款了解更多信息。
受保护脚本
此脚本以闭源形式发布。 但是,您可以自由使用,没有任何限制 — 了解更多信息这里。
免责声明
这些信息和出版物并非旨在提供,也不构成TradingView提供或认可的任何形式的财务、投资、交易或其他类型的建议或推荐。请阅读使用条款了解更多信息。