OPEN-SOURCE SCRIPT
Grouped EMAs
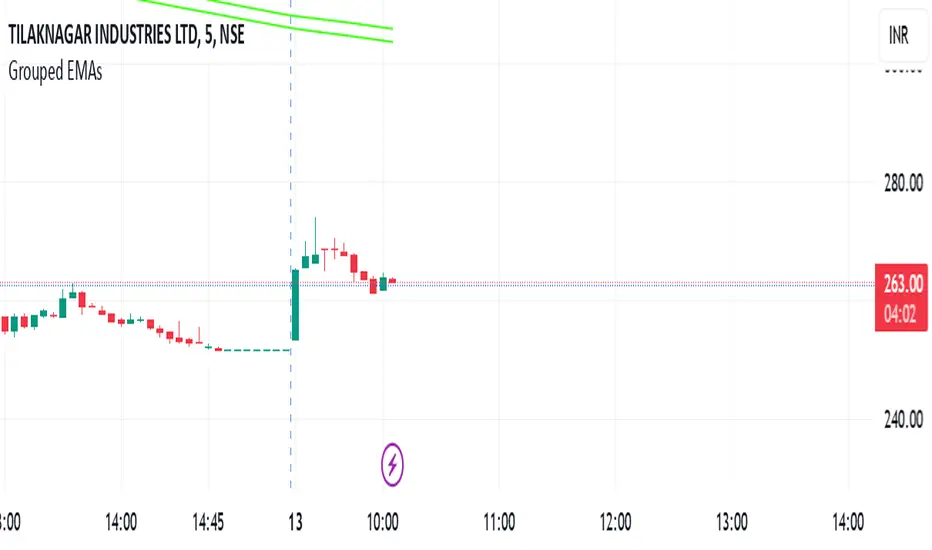
This indicator displays grouped EMAs across multiple timeframes (5m, 15m, 30m, and 60m) on a single chart. It allows traders to easily track key EMA levels across different timeframes for better trend analysis and decision-making.
Key Features:
Adjustable EMA Length: Change the EMA period once, and it updates across all timeframes simultaneously.
Multi-Timeframe Support: Displays 365 EMA High and Low for 5-minute, 15-minute, 30-minute, and 60-minute intervals.
Clear Color Coding: Each timeframe is color-coded for quick visual recognition.
How to Use:
Adjust the EMA length using the input option to set your preferred period.
Observe the EMAs across different timeframes to identify support, resistance, and trend directions.
Combine with other indicators or price action strategies for enhanced trading insights.
This tool is ideal for traders looking to simplify multi-timeframe analysis while maintaining flexibility with the EMA period.
Enjoy more informed trading and enhanced trend analysis with Grouped EMAs!
开源脚本
秉承TradingView的精神,该脚本的作者将其开源,以便交易者可以查看和验证其功能。向作者致敬!您可以免费使用该脚本,但请记住,重新发布代码须遵守我们的网站规则。
免责声明
这些信息和出版物并非旨在提供,也不构成TradingView提供或认可的任何形式的财务、投资、交易或其他类型的建议或推荐。请阅读使用条款了解更多信息。
开源脚本
秉承TradingView的精神,该脚本的作者将其开源,以便交易者可以查看和验证其功能。向作者致敬!您可以免费使用该脚本,但请记住,重新发布代码须遵守我们的网站规则。
免责声明
这些信息和出版物并非旨在提供,也不构成TradingView提供或认可的任何形式的财务、投资、交易或其他类型的建议或推荐。请阅读使用条款了解更多信息。